1D Profiles Reader
This page explains how to use the 1D Profiles Reader to visualize 1D profile data.
Supported IDSs
Currently, the following IDS and structures are supported in the 1D Profiles Reader:
IDS |
Structure |
|---|---|
|
|
|
Using the 1D Profiles Reader
The 1D Profiles Reader functions similarly to the GGD Reader, with the same interface and data loading workflow. This means that the steps for loading an URI, an IDS, and selecting attributes are identical. Refer to the GGD Reader for detailed instructions on:
Loading an URI: How to provide the file path or select a dataset.
Loading an IDS: How to load a dataset and display the grid.
Selecting attribute arrays: How to choose and visualize attributes.
Mapping 1D profiles to 2D
For information on how to map 1D profiles to a 2D grid, refer to the section 1D Profiles Mapper.
Plotting 1D profiles
The 1D Profiles Reader outputs vtkTable data, this can be plotted in a 1D plot.
After loading the attribute arrays using the steps above, apply the Plot Data Paraview filter
(For more information on applying filters in Paraview, have a look at the Paraview documentation).
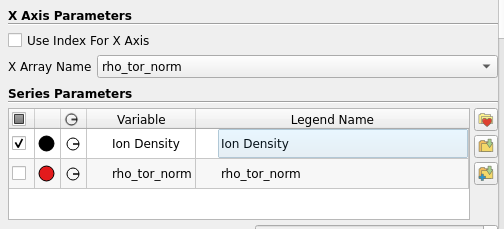
Within the Plot Data filter options, disable the Use Index For X Axis option,
and in the drop-down menu, select the array to use as X-axis (e.g. rho_tor_norm).
The profiles that should be plotted can now be selected.
|
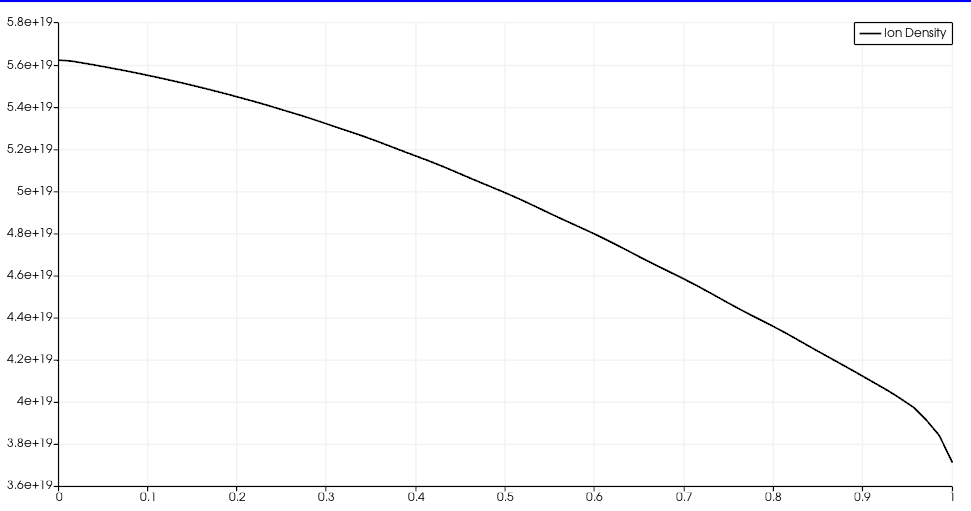
The plotted |