Scalar Time Trace Reader
This page explains how to use the Scalar Time Trace Reader to visualize time-dependent scalar data in IDSs.
Supported IDSs
All IDSs are supported in the Scalar Time Trace Reader. Upon loading an IDS, the reader will automatically scan the IDS for quantities which are:
Time-dependent
Either floating point or integer
Either a 0D quantity inside a time dependent Array of Structure, or a 1D quantity with time as its coordinate.
Using the Scalar Time Trace Reader
The Scalar Time Trace Reader functions similarly to the GGD Reader, with the same interface and data loading workflow. This means that the steps for loading an URI, an IDS, and selecting attributes are identical. Refer to the GGD Reader for detailed instructions on:
Loading an URI: How to provide the file path or select a dataset.
Loading an IDS: How to load a dataset and display the grid.
Selecting attribute arrays: How to choose and visualize attributes.
Visualizing a time trace
The Scalar Time Trace Reader outputs vtkTable data, containing the time traces of the selected quantities. These quantities can be visualized in a 1D line chart plot, with time on the horizontal axis. After loading the the selected quantities using the steps above, you can visualize the data using the 'Line Chart View' in ParaView. See Paraview's documentation to learn more about how to use this view.
Within the 'Line Chart View' options, disable the Use Index For X Axis option,
and in the drop-down menu, select Time [s] to display time on the horizontal axis in the line chart.
Tip
The Line Chart View can be opened side-by-side with other ParaView views. This means that this reader allows you to visualize how scalar quantities (e.g., the plasma current) evolve over time, while simultaneously displaying time-dependent 3D geometries loaded from other readers.
This reader supports two ways of visualizing data:
Partial Time Trace Up to Selected Time (Default)
When the
Show Full Time Traceoption is disabled in the plugin properties, the reader outputs only the time trace up to the currently selected time. This allows you to inspect the evolution of the selected quantities.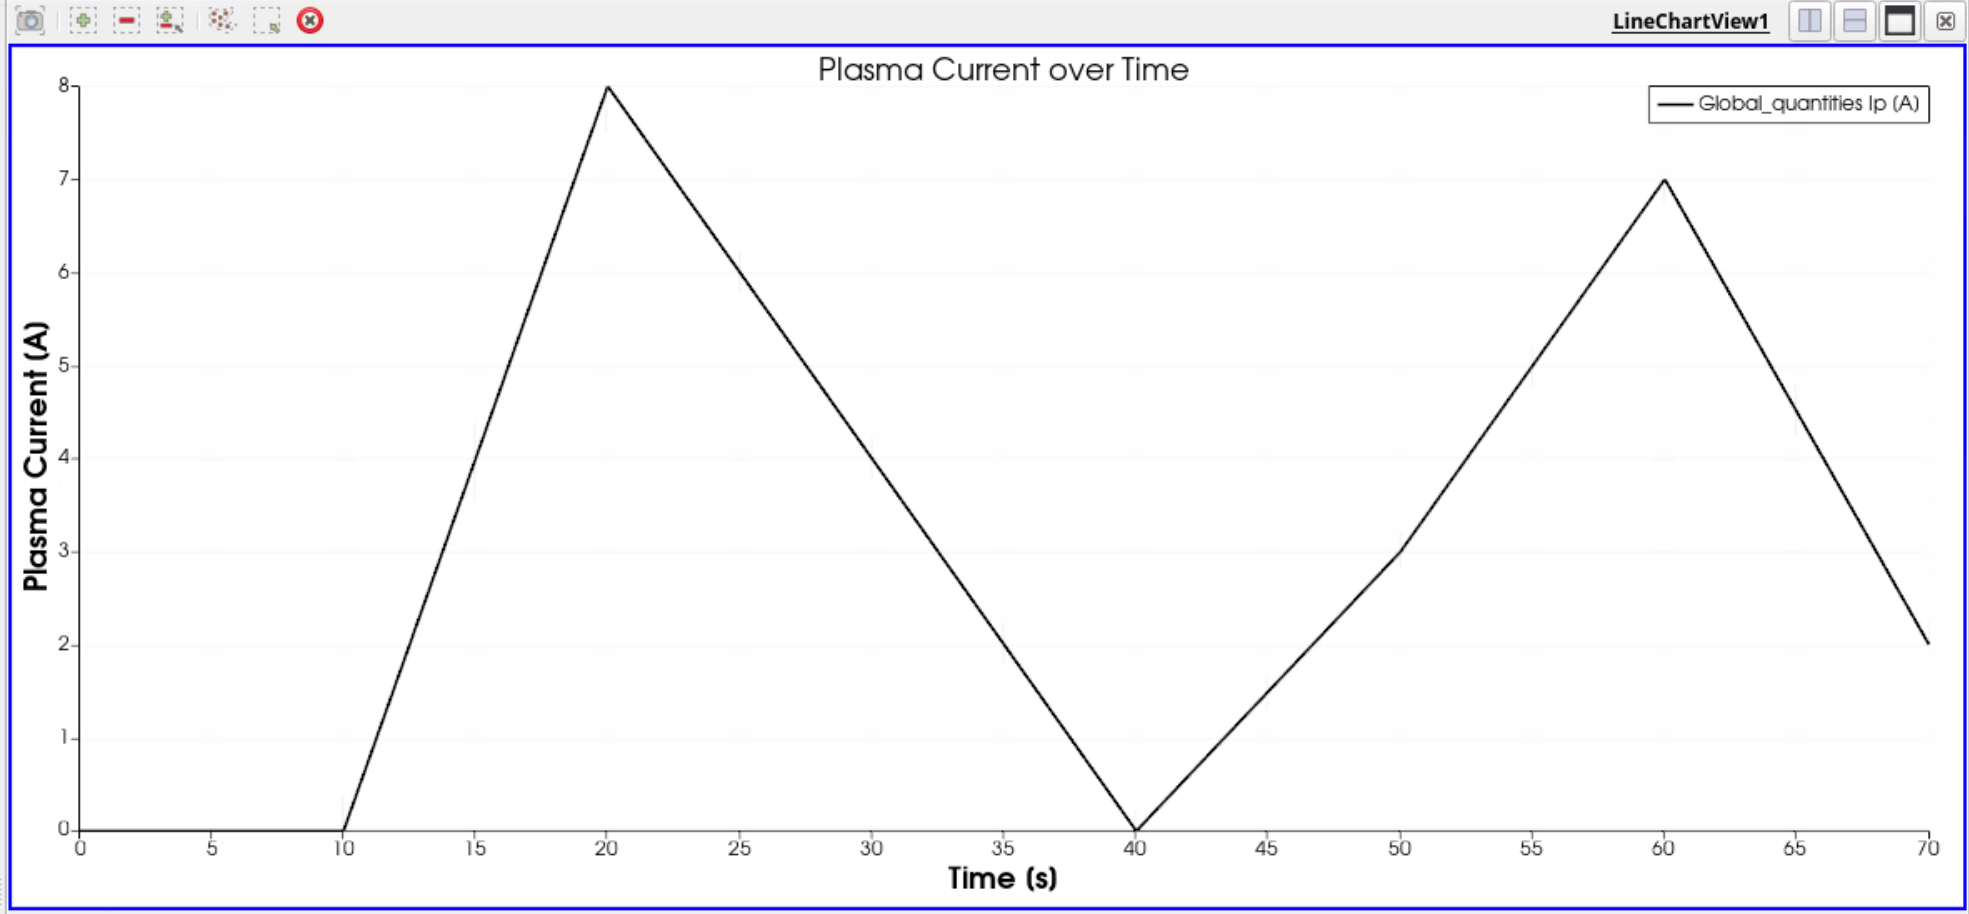
Plasma current over time with
Show Full Time Tracedisabled (default), where the selected time step is 70s.¶Full Time Trace with Highlighted Current Time
When the
Show Full Time Traceoption is enabled, the reader outputs the complete time trace for the selected quantities. In addition, aTime Markercolumn is outputted, which marks the currently selected time step. This allows you to see the entire time series from start to finish.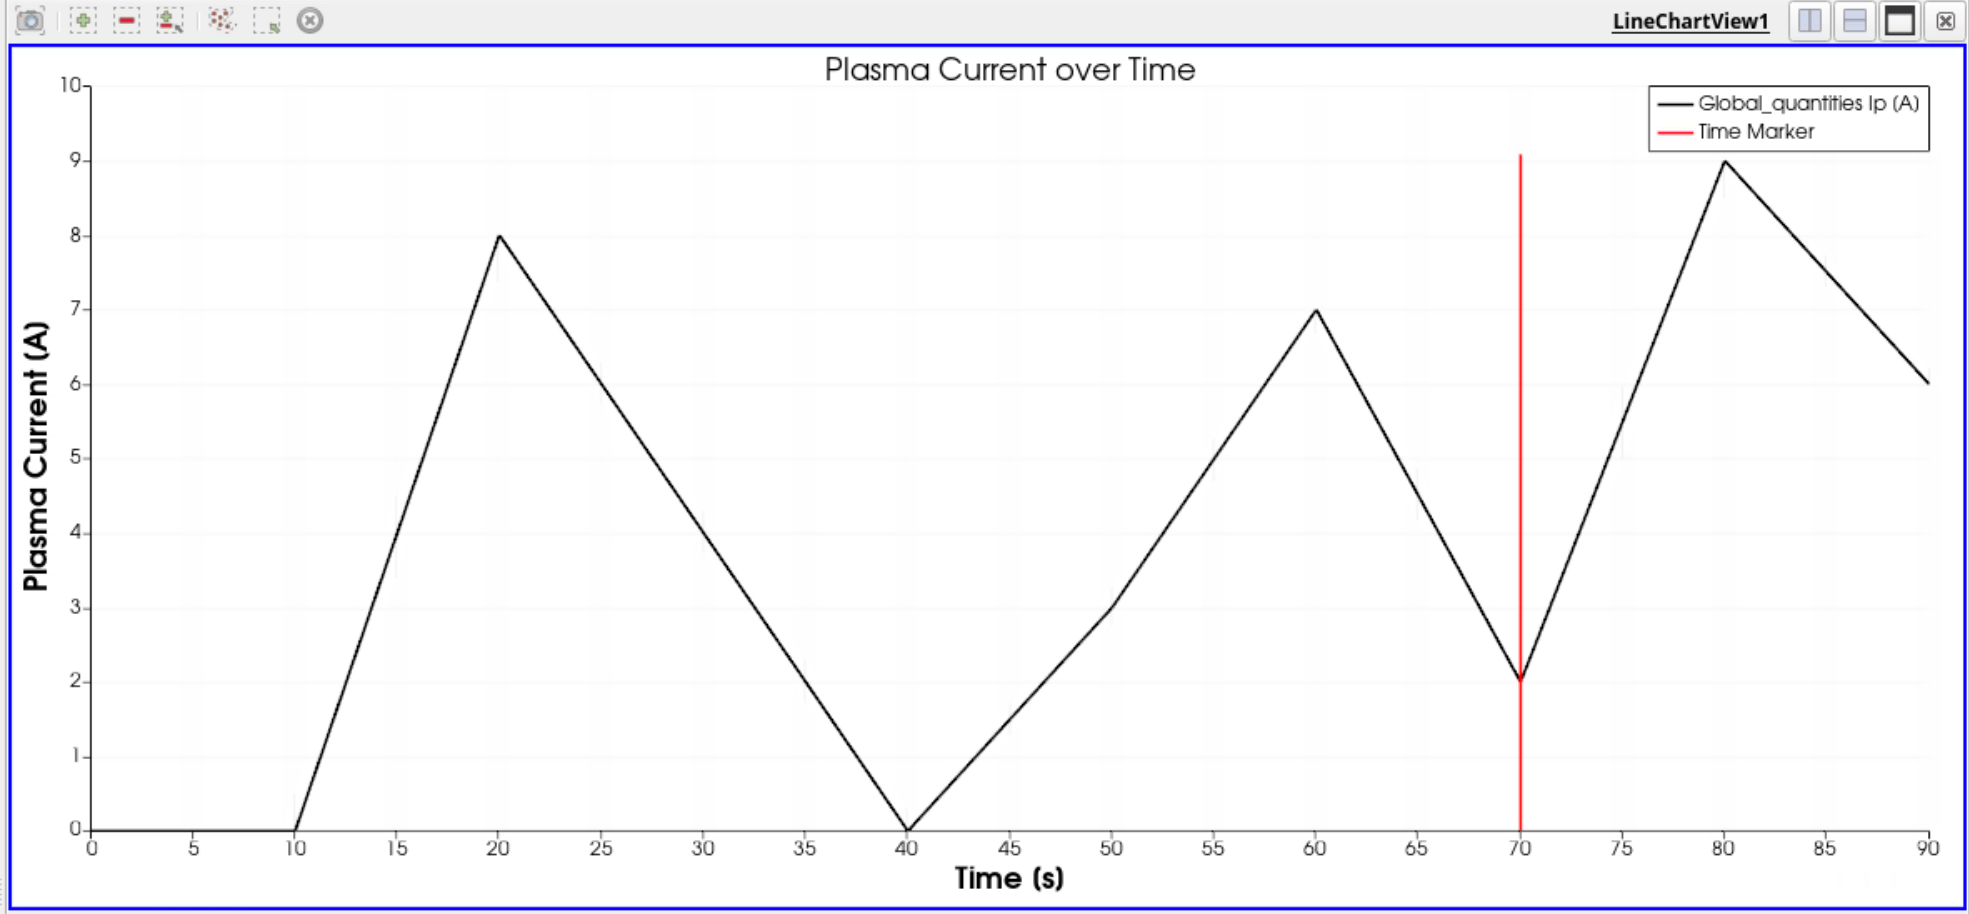
Plasma current over time with
Show Full Time Traceenabled, where the selected time step is 70s.