1D Profiles Mapper
The 1D Profiles Mapper is a ParaView filter designed to map 1D profiles onto a 2D flux grid. It is designed to work in conjunction with 1D profiles exported by the 1D Profiles Reader. These profiles can be interpolated on a 2D Psi grid which can be provided either in the form of a GGD, by using one of either the GGD Reader or the JOREK Reader, or by means of a 2D profile from the 2D Profiles Reader.
A Poloidal Flux (Psi) from a GGD source (GGD Reader or JOREK Reader), or 2D Profiles Reader as input 0.
A 1D profile from the 1DProfilesReader as input 1.
The 1DProfilesReader must provide at least the Psi grid coordinate but may include any number of additional 1D profiles. The filter resamples the 1D profiles onto the 2D Psi grid.
Note
If the 1D profile contains values outside of the range of the values of the Psi grid, these points will be mapped to NaN values.
Example Usage
Load a GGD or 2D Profile that contains a poloidal flux (Psi) grid. Ensure that the Psi is selected in the attribute window. In the example figure below, a 2D profile from equilibrium is used.
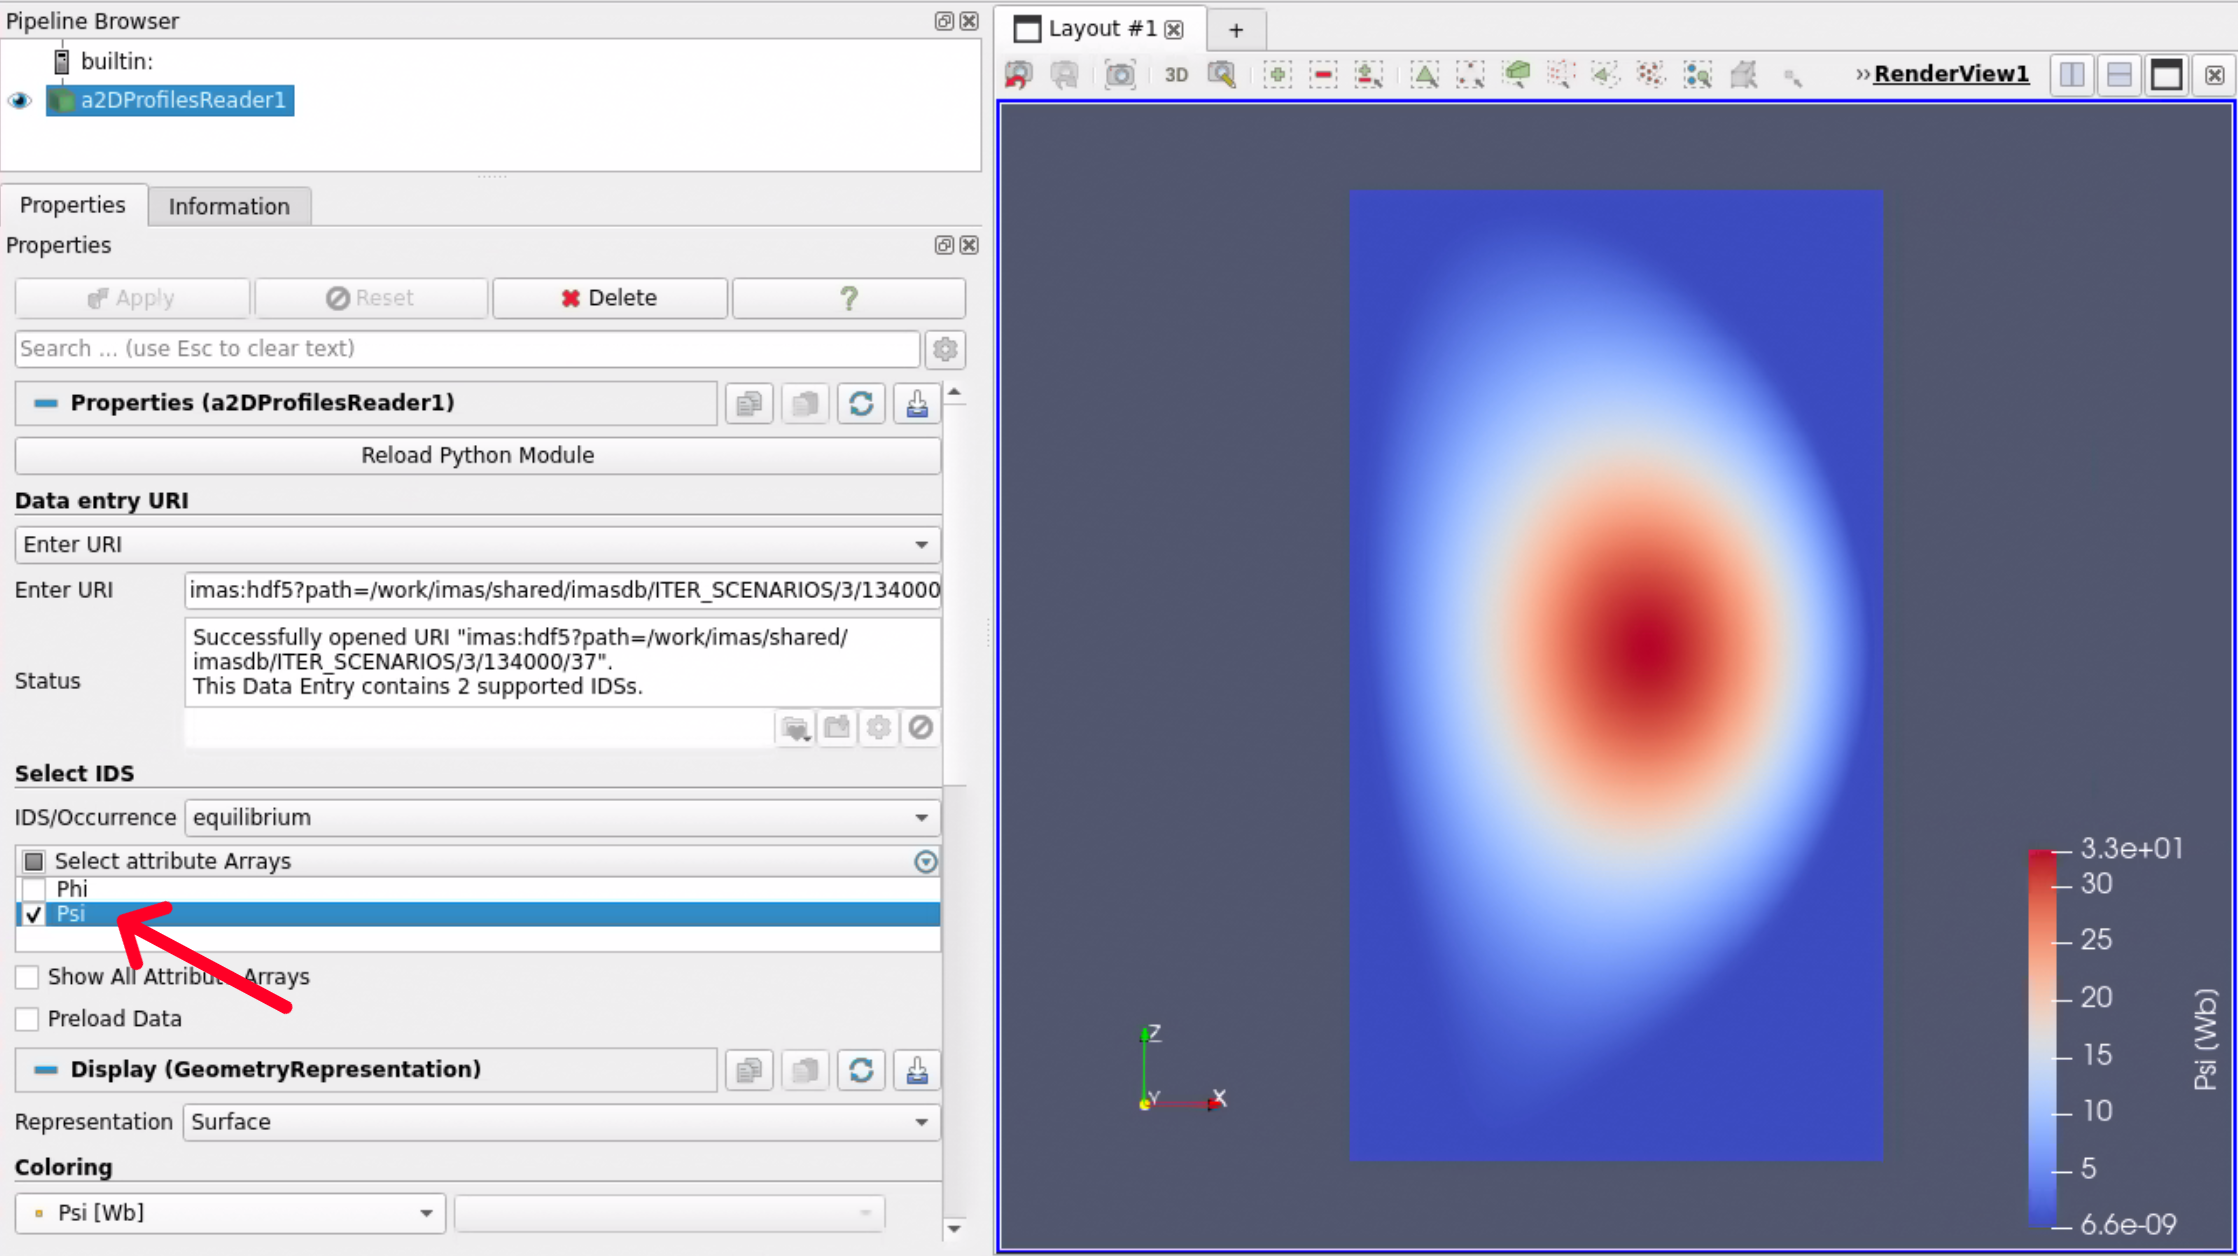
A 2D profile from an equilibrium IDS with the Psi grid selected.
Load a profile using the 1DProfilesReader, and ensure you select the
Grid Psiattribute. You may also select any of the 1d profiles that you would like to map. These profiles will be taken as input for the the 1D Profiles Mapper filter.
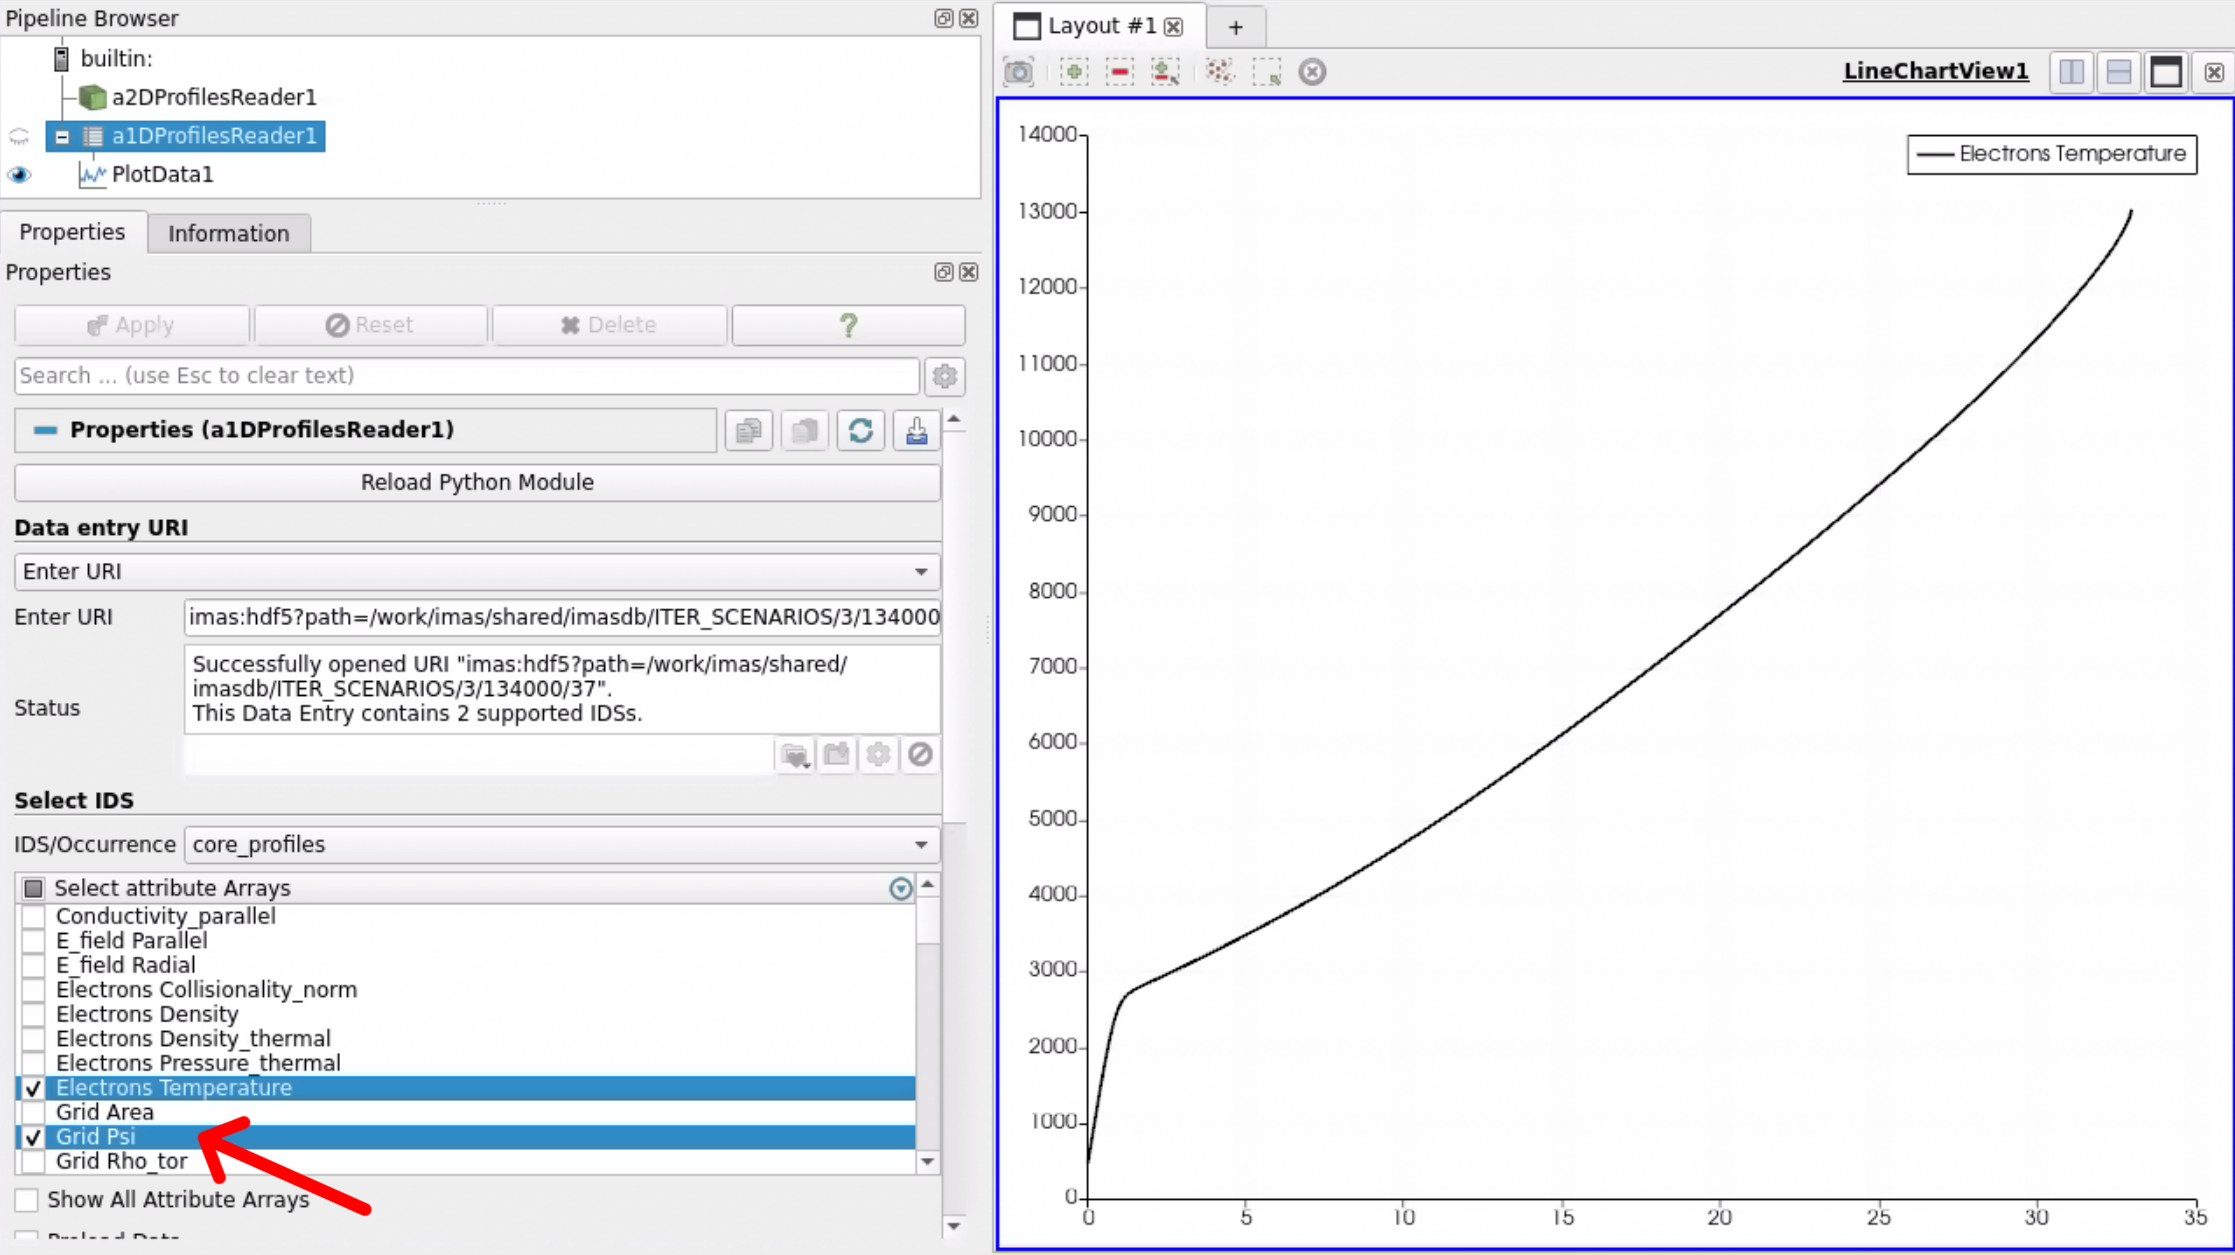
A core profiles IDS loaded with the 1D Profiles Reader. Here, the Grid Psi and Electron Temperature profile are selected.
Select the 1DProfilesReader within the pipeline browser on the top-left.
Go to Filters -> IMAS Tools and select the
1D Profiles Mapper.A pop-up window will appear where you must select which Paraview reader maps to which input port in the filter. For the Psi grid, select the reader that contains your psi grid. For the 1D Profile, select the 1D Profile Reader, and press Ok.
Load the filter by pressing Apply.
The filter will now show the 1D Profiles that you enabled in step 2 in the array selection window of the 1DProfilesReader. Select which 1D profiles you want to map onto the 2D grid. And finally press Apply.
You can now select the resampled profile in the coloring section.

The Electron Temperature 1D profile mapped onto the 2D poloidal flux grid from an MHD IDS. Here, the NaN values are colored in translucent black.
Warning
The filter does not take into account which parts of the 2D flux map are inside or outside the LCFS. 1D profiles are typically only valid within the core plasma, so care should be taken when interpreting data outside of the LCFS. This effect is clearly demonstrated in the figure below.
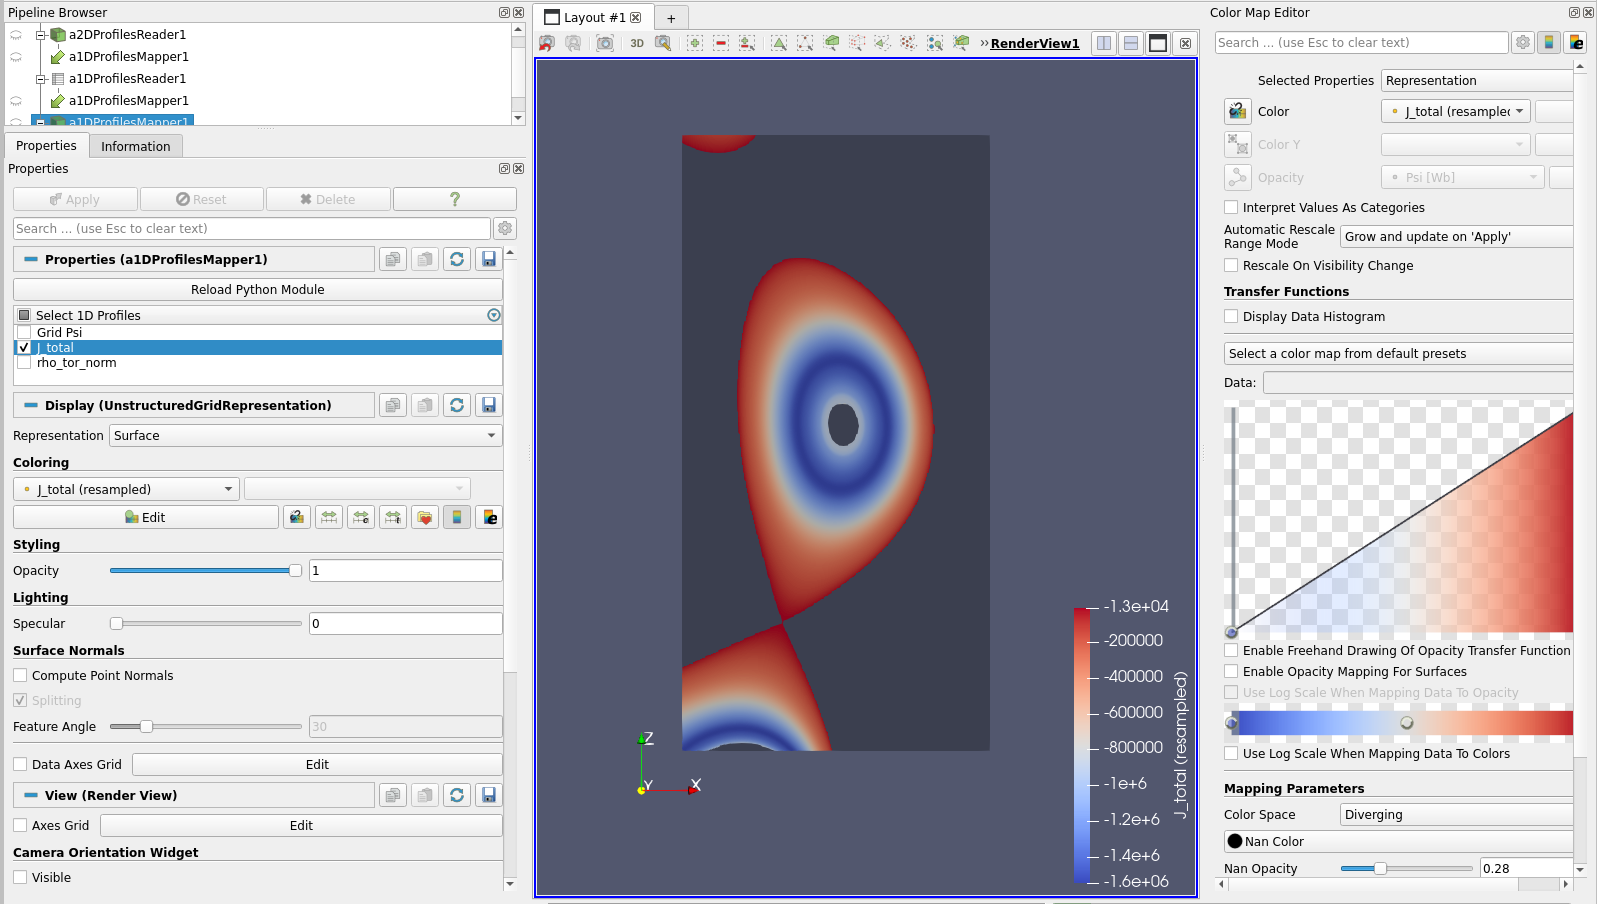
The total parallel current density 1D profile mapped onto the 2D Psi profile of an equilibrium IDS.