SOLPS-ITER Case
In this example, we will load and visualize a SOLPS-ITER GGD grid and several quantities defined on this GGD grid. We first visualize the electron pressure from the edge_profiles IDS.
Next, we learn how to extract grid subsets of the GGD grid using the MultiBlock Inspector. GGD grid subsets represent a portion of the contents of a larger full grid, usually intended for more accurate analysis of an exactly specified piece of the grid. Which grid subsets are available depends on the data provider (in this case SOLPS).
Finally, we will visualize the density of the Ne and the D ions side-by-side, and visualize the ratio of the two using ParaView's calculator functionality.
You can download the ParaView state file for this example here. However, we recommend that you manually follow the steps outlined below.
Loading the Electron Pressure
In this subsection, we will load the SOLPS GGD grid and visualize the electron pressure on this grid.
Navigate to Sources > IMAS Tools and select the GGD Reader.
Enter the following URI in the
Enter URIfield of the GGD reader plugin, and selectApply:imas:hdf5?path=/work/imas/shared/imasdb/ITER_SCENARIOS/3/123364/1Select the
edge_profilesIDS in the IDS/Occurrence dropdown menu.Select
Applyto load the edge profiles GGD grid.After the GGD grid is loaded, bring the grid into view by aligning the viewpoint in the positive Y direction using the following button:
 .
.Select the
Electrons Pressurefrom the attribute array selection window.Select
Applyto load the electron pressure values on the grid.Select
Electrons Pressure [Pa]in the coloring dropdown to visualize the electron pressure.
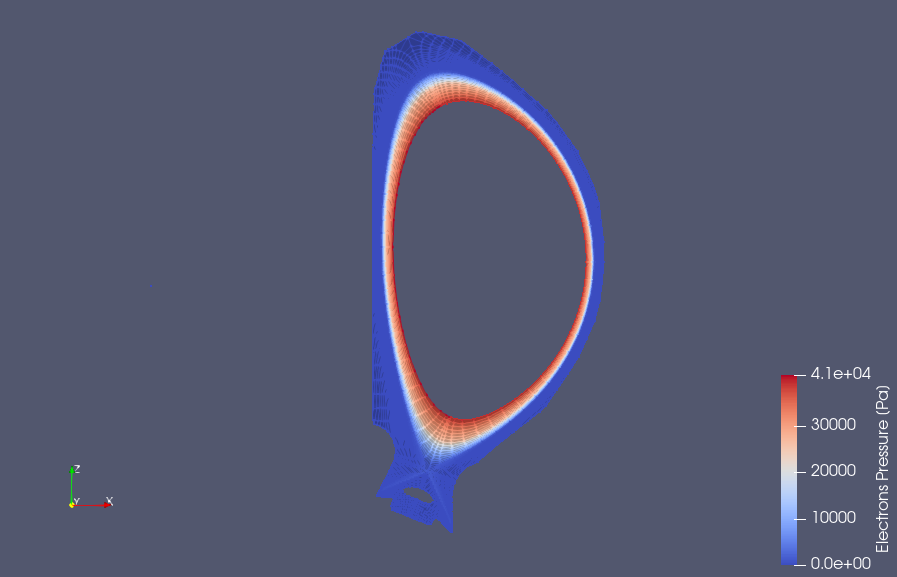
Edge Profiles GGD showing the electron pressure. Data provided by X. Bonnin.
Extracting grid subsets from GGD
In this subsection, we will learn how to extract grid subsets from a GGD grid. Specifically, we will extract the inner SOL, core and separatrix GGD grid subsets. For more information on the GGD format and how it is structured, see the Data Dictionary documentation.
We can view the different types of grid subsets that are stored in the GGD by using the MultiBlock Inspector. This can be found under View > MultiBlock Inspector.
The MultiBlock Inspector shows the different grid subsets that are stored in this GGD object. In our case, we want to view only
SOL,COREandSEPARATRIXgrid subsets. Select those using MultiBlock Inspector and ensure all other grid subsets are deselected. You should now see the electron pressure for only the selected grid subsets.
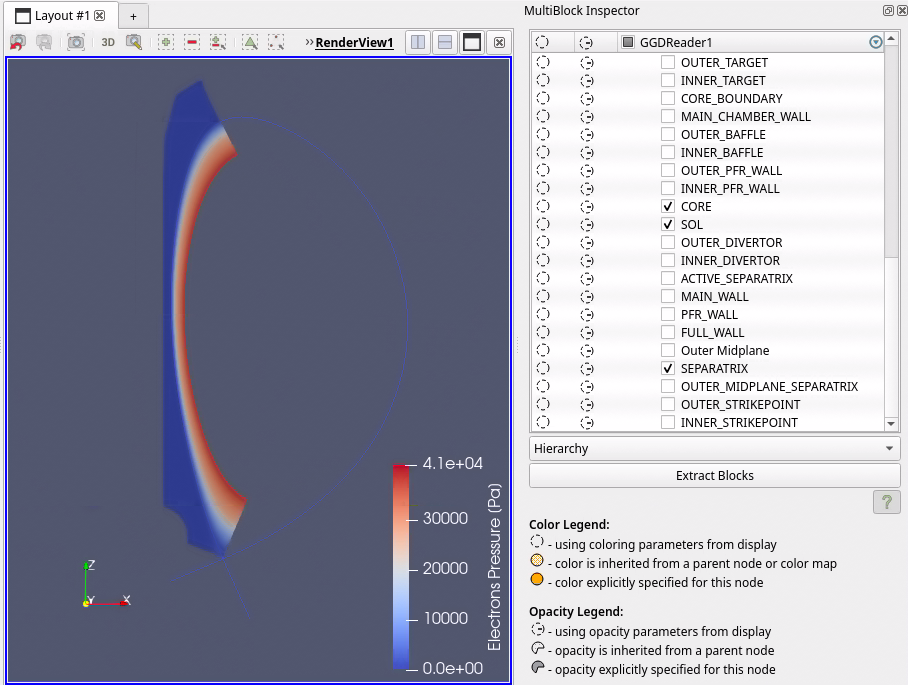
Electron Pressure defined on the core, SOL and separatrix. Data provided by X. Bonnin.
Visualizing Ion Density
This subsection demonstrates how to visualize the density of Deuterium (D) and Neon (Ne) ions across the complete GGD grid, as well as compute and visualize their density ratio.
Start by selecting all the grid subsets again in the MultiBlock Inspector and then close the MultiBlock Inspector. You should now see the full GGD grid again.
We will visualize the density of the Ne and D ions on the GGD grid. Select the
Ion Densityin the Select attribute array selection.Click on
Applyto load the ion densities.You should now see both
Ion (D) Density [m^-3]andIon (Ne) Density [m^-3]options in the coloring dropdown. We want to visualize them side by side. To do so, open a new RenderView by pressing the following button: .
.In the Create View section select the
Render Viewbutton to create a new RenderView, and ensure you enable viewing of the GGD reader by selecting the eye icon.Select the left render view, and select the D density in the coloring section. Similarly, select the right render view and select the Ne density in the coloring section.
We will now create another render view, in which we will show the ratio of the Ne / D ion density. First, create a new RenderView like before, select the GGD reader and apply the calculator tool, under Filters > Data Analysis > Calculator.
In the calculator properties, change the Attribute Type to Cell Data, set the result array name to
Ne / D Density. Next, under the Scalars dropdown, select theIon (Ne) Density [m^-3], then the division symbol, followed byIon (D) Density [m^-3]. The calculator input should now show:"Ion (Ne) Density [m^-3]"/"Ion (D) Density [m^-3]".Select the
Applybutton, and select theNe / D Densityin the coloring dropdown menu.
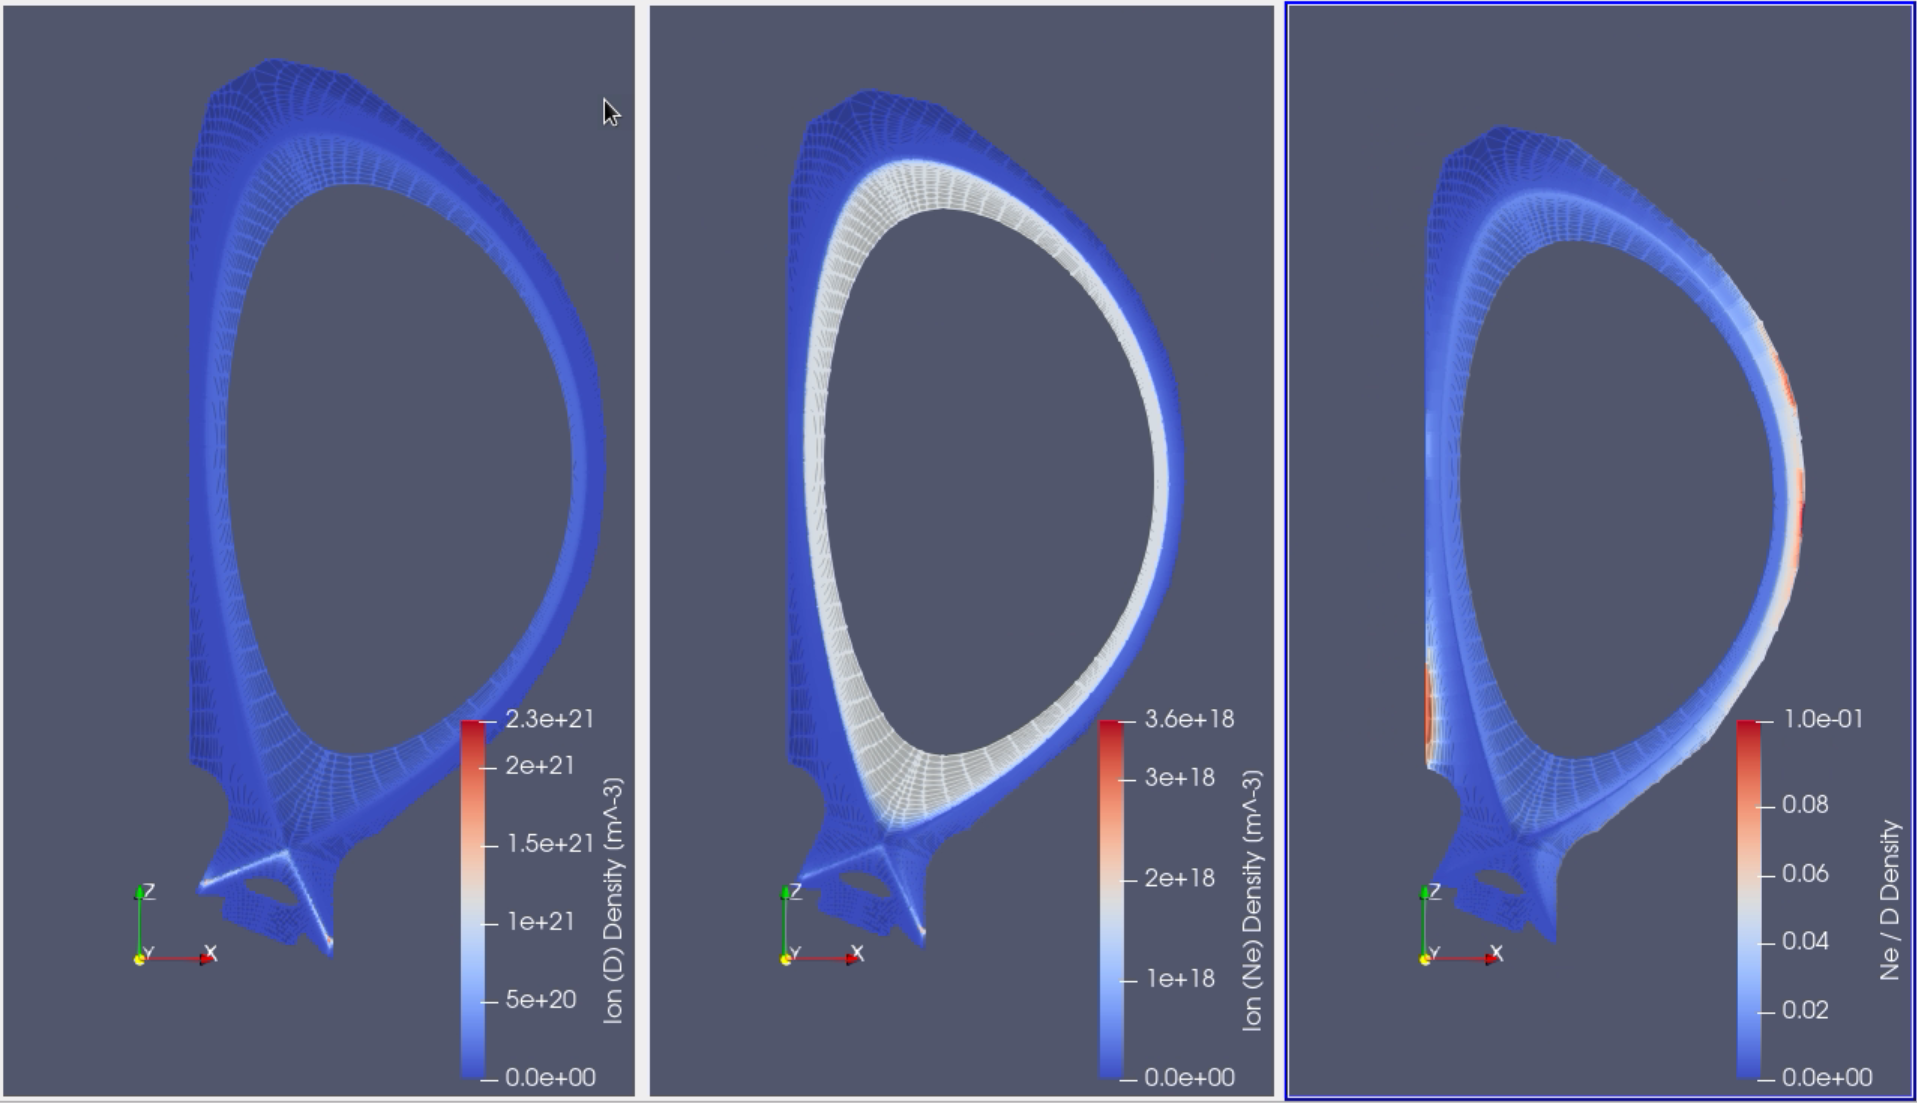
Grid showing the Deuterium density (left), the Neon density (middle), and the ratio of Neon over Deuterium density (right). Data provided by X. Bonnin.