Distributions Reader
New in version 2.4.0.
This page explains how to use the Distributions Reader. This reader can visualize the set of time-dependent markers (test particles) of a distributions IDS.
Supported IDSs
Currently, the following IDS and structures are supported in the Distributions Markers Reader:
IDS |
Structure |
|---|---|
|
Using the Distributions Reader
The Distributions Reader functions similarly to the GGD Reader, with the same interface and data loading workflow. This means that the steps for loading an URI, an IDS, and selecting attributes are identical. Refer to the GGD Reader for detailed instructions on:
Loading an URI: How to provide the file path or select a dataset.
Loading an IDS: How to load a dataset and display the grid.
Selecting attribute arrays: How to choose and visualize attributes.
Plugin Settings
The Distributions Reader allows you to load the coordinates available in the distribution, marked by the coordinate_identifiers.
By default, the reader will try to use x, y, and z coordinates in Paraview,
if they are available in the distribution's coordinate identifiers. It is also possible
to map other coordinates in the distribution onto the ParaView axes using the
dropdown menus under the Axis Coordinate Mapping settings. Optionally, a scaling
factor can be applied for each axis.
Note
This reader assumes that the coordinate_identifiers of a distribution stays the same over time.
Examples
The following examples use the distributions IDS from this URI, provided by J. Artola.
imas:hdf5?user=artolaj;pulse=111111;run=1;database=markers;version=4
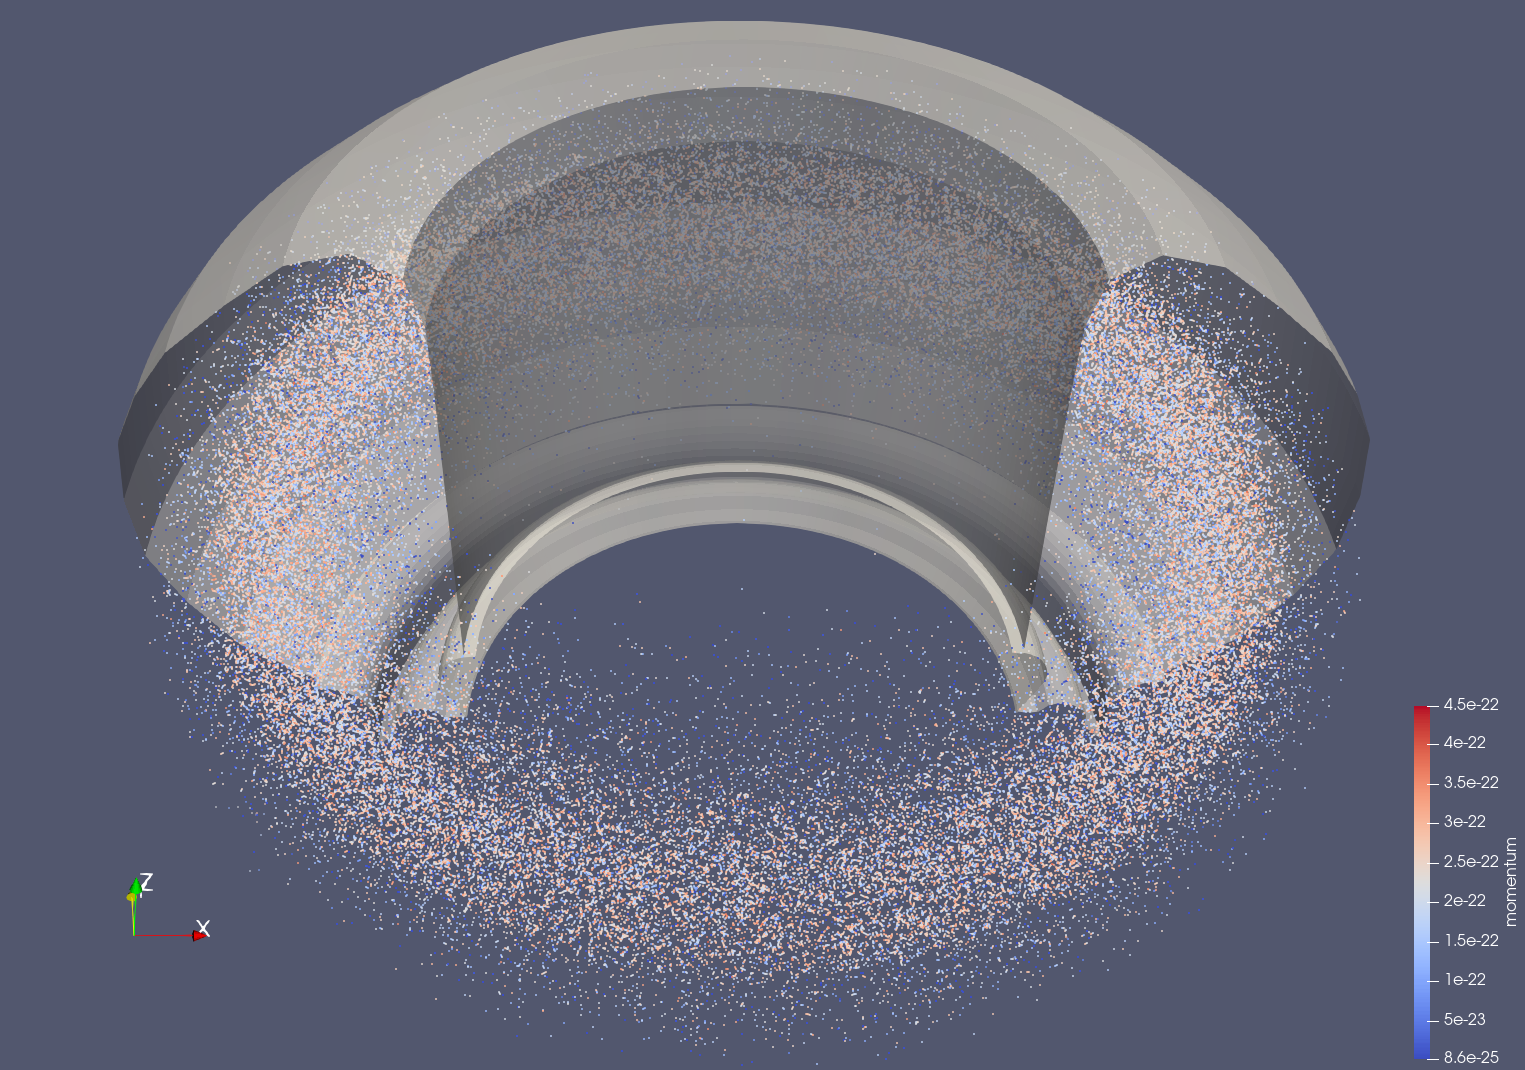
Positions of markers of the electron distribution, colored by momentum. The divertor and first wall from the ITER machine description are shown in translucent white.
The next example shows the marker particles in momentum space.
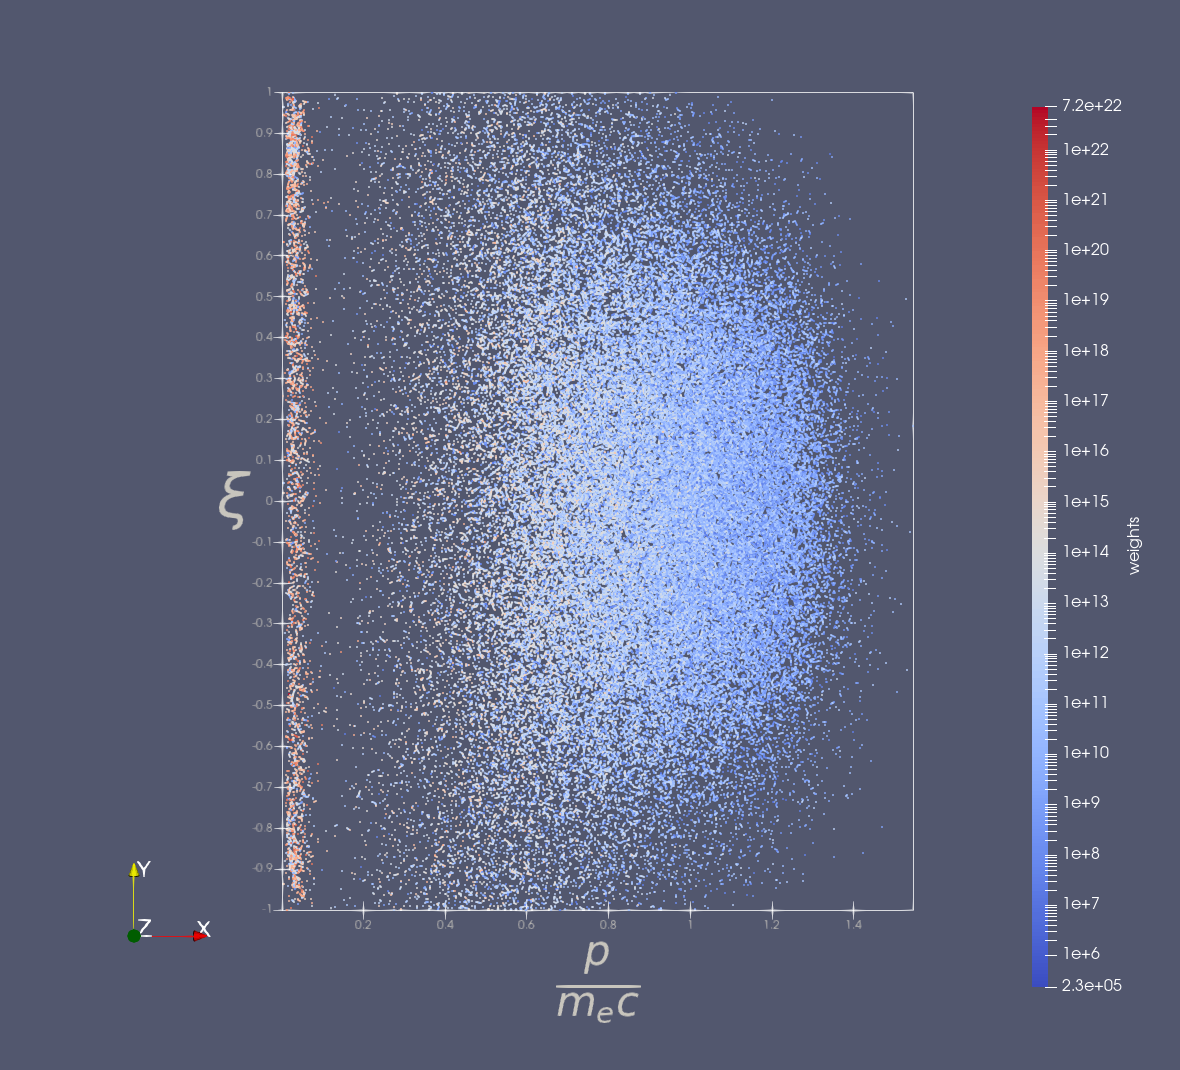
Positions of markers of electron distribution in momentum space, colored by marker weight.
The momentum coordinate was mapped onto the X-axis and scaled by \(\frac{1}{m_e c}\),
where \(m_e\) is the electron mass, and \(c\) the speed of light. The pitch
coordinate was mapped onto the Y-axis.