Gallery
The gallery showcases the capabilities of what you can do with the IMAS-ParaView plugins. You can click on the images to enlarge them and to display their descriptions.
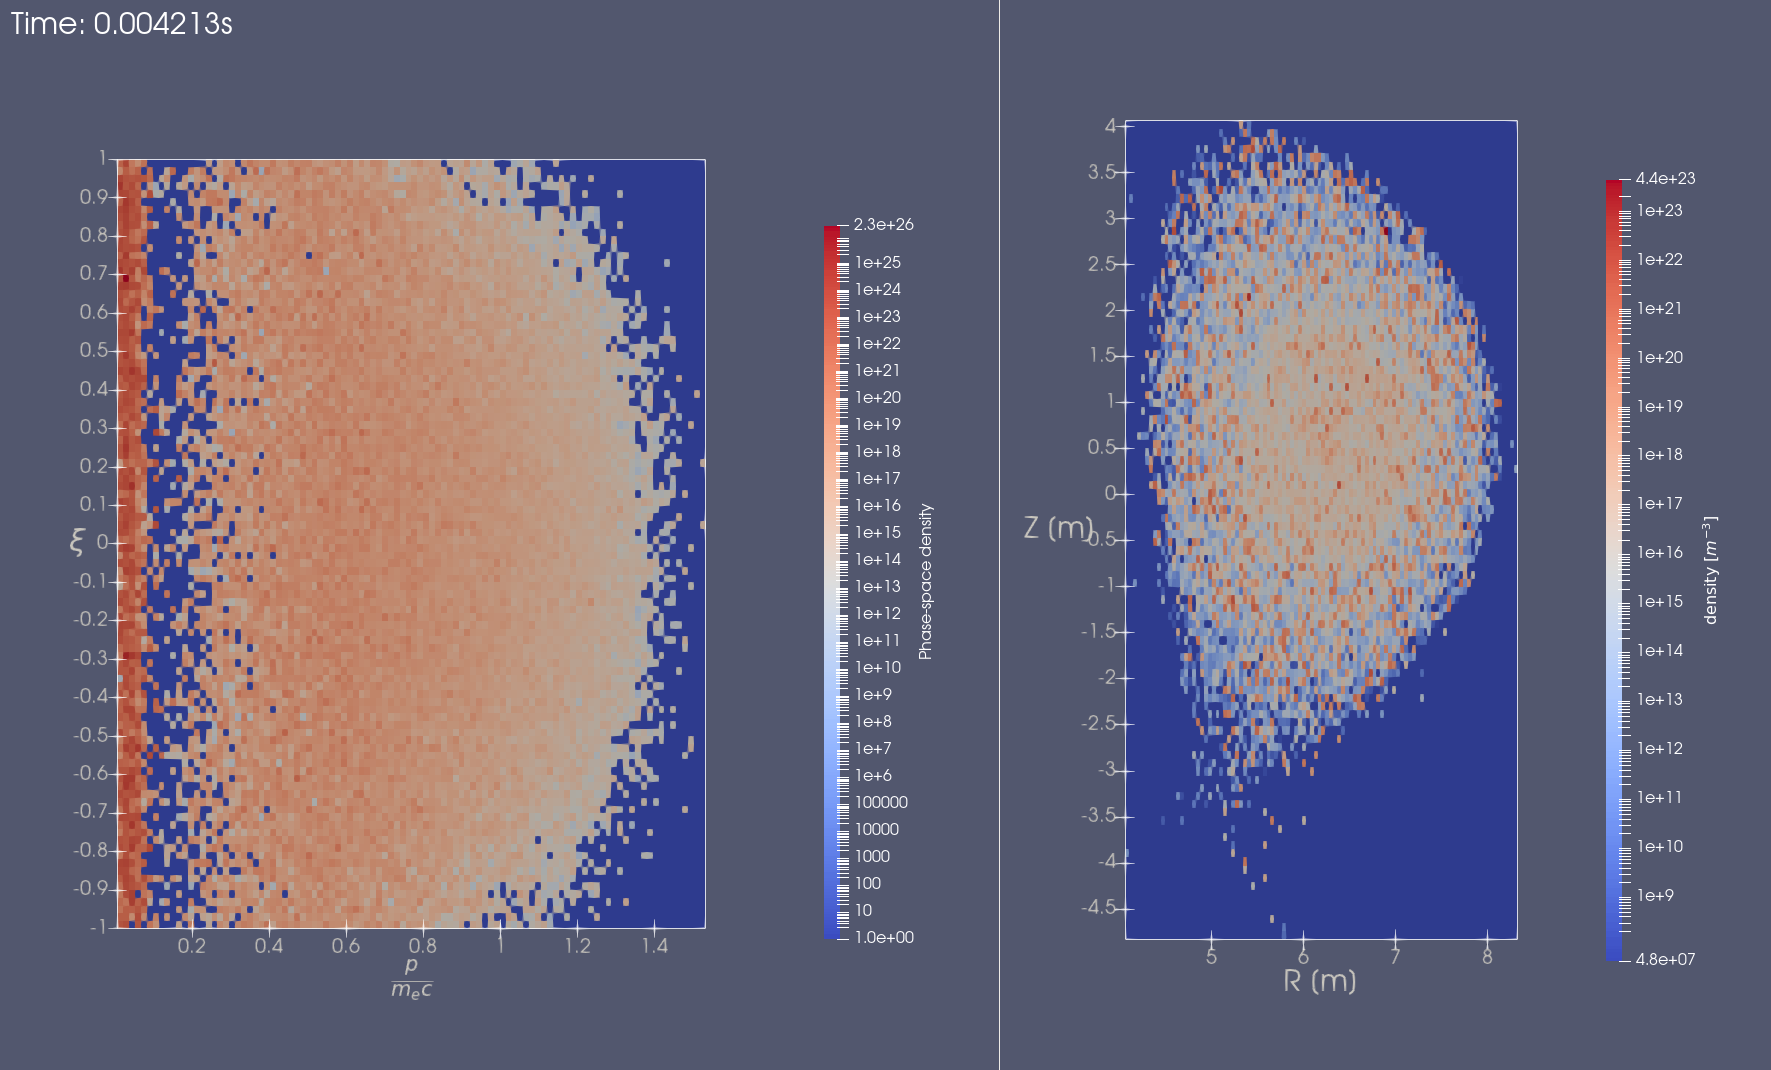
2D Histograms of Electron Marker Distributions
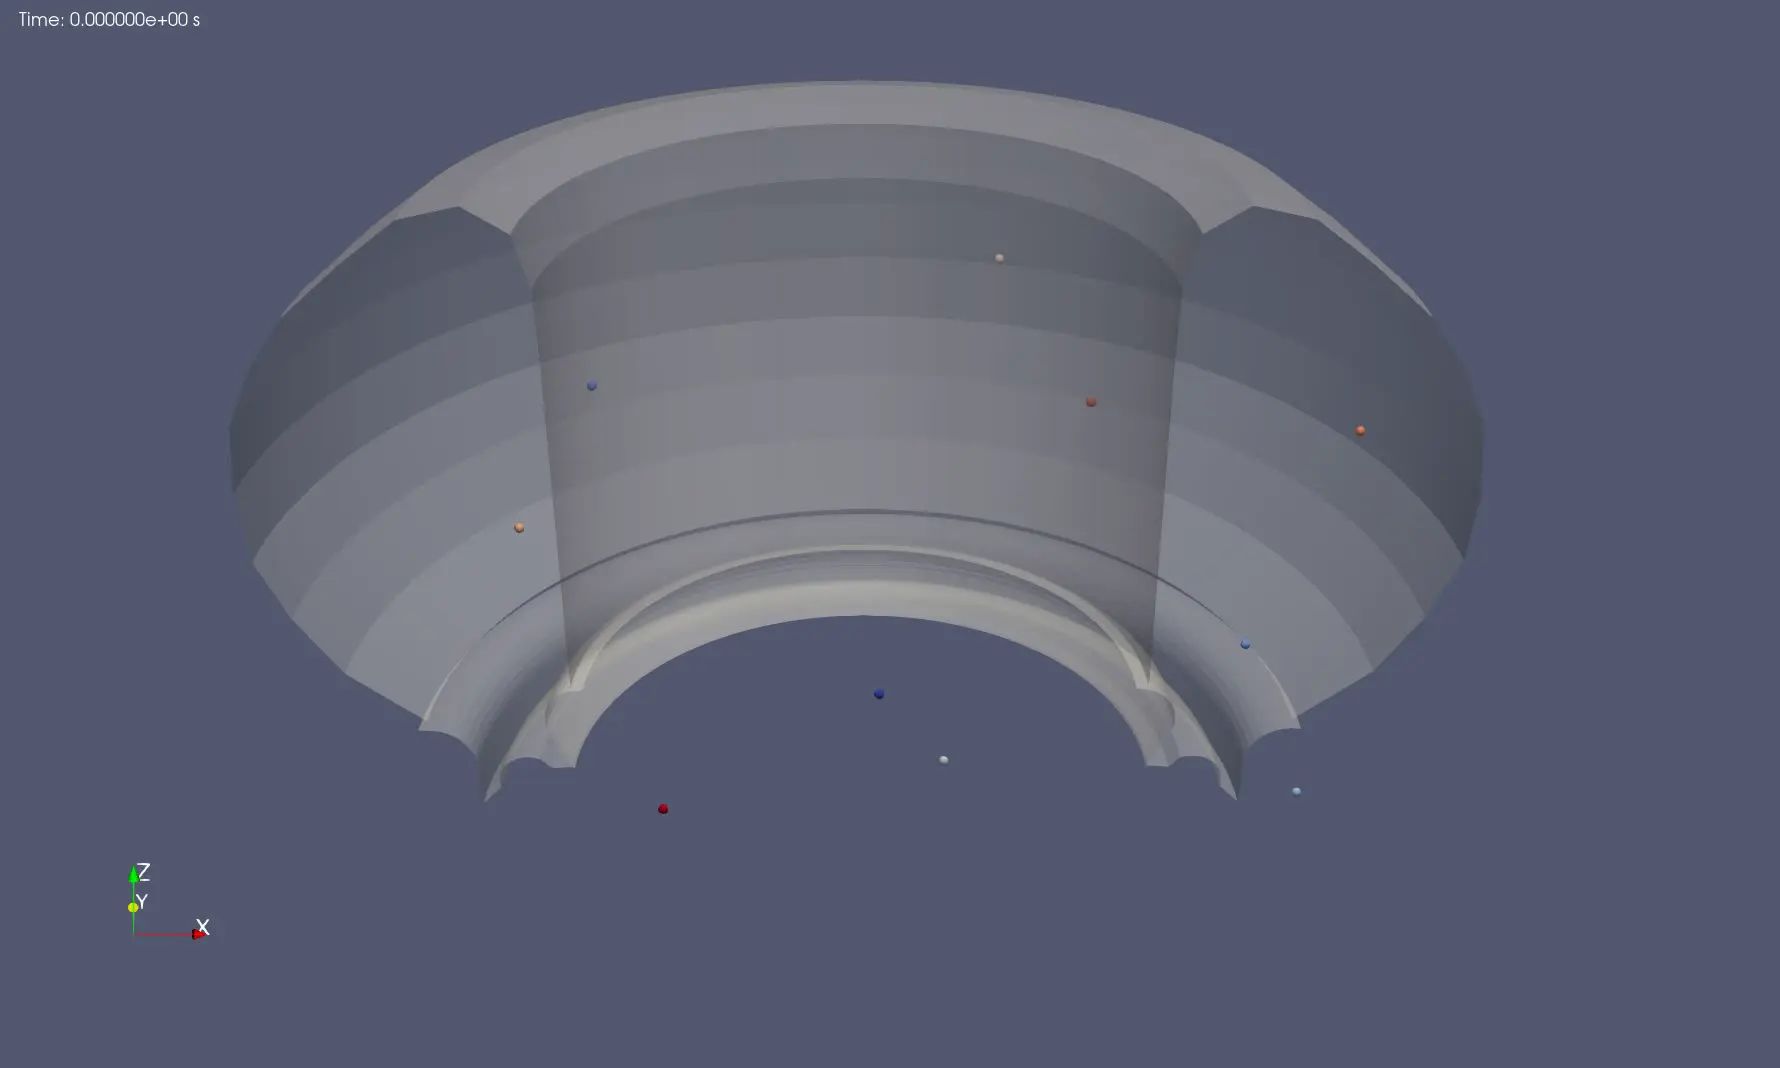
Distributions Markers Particle Tracing
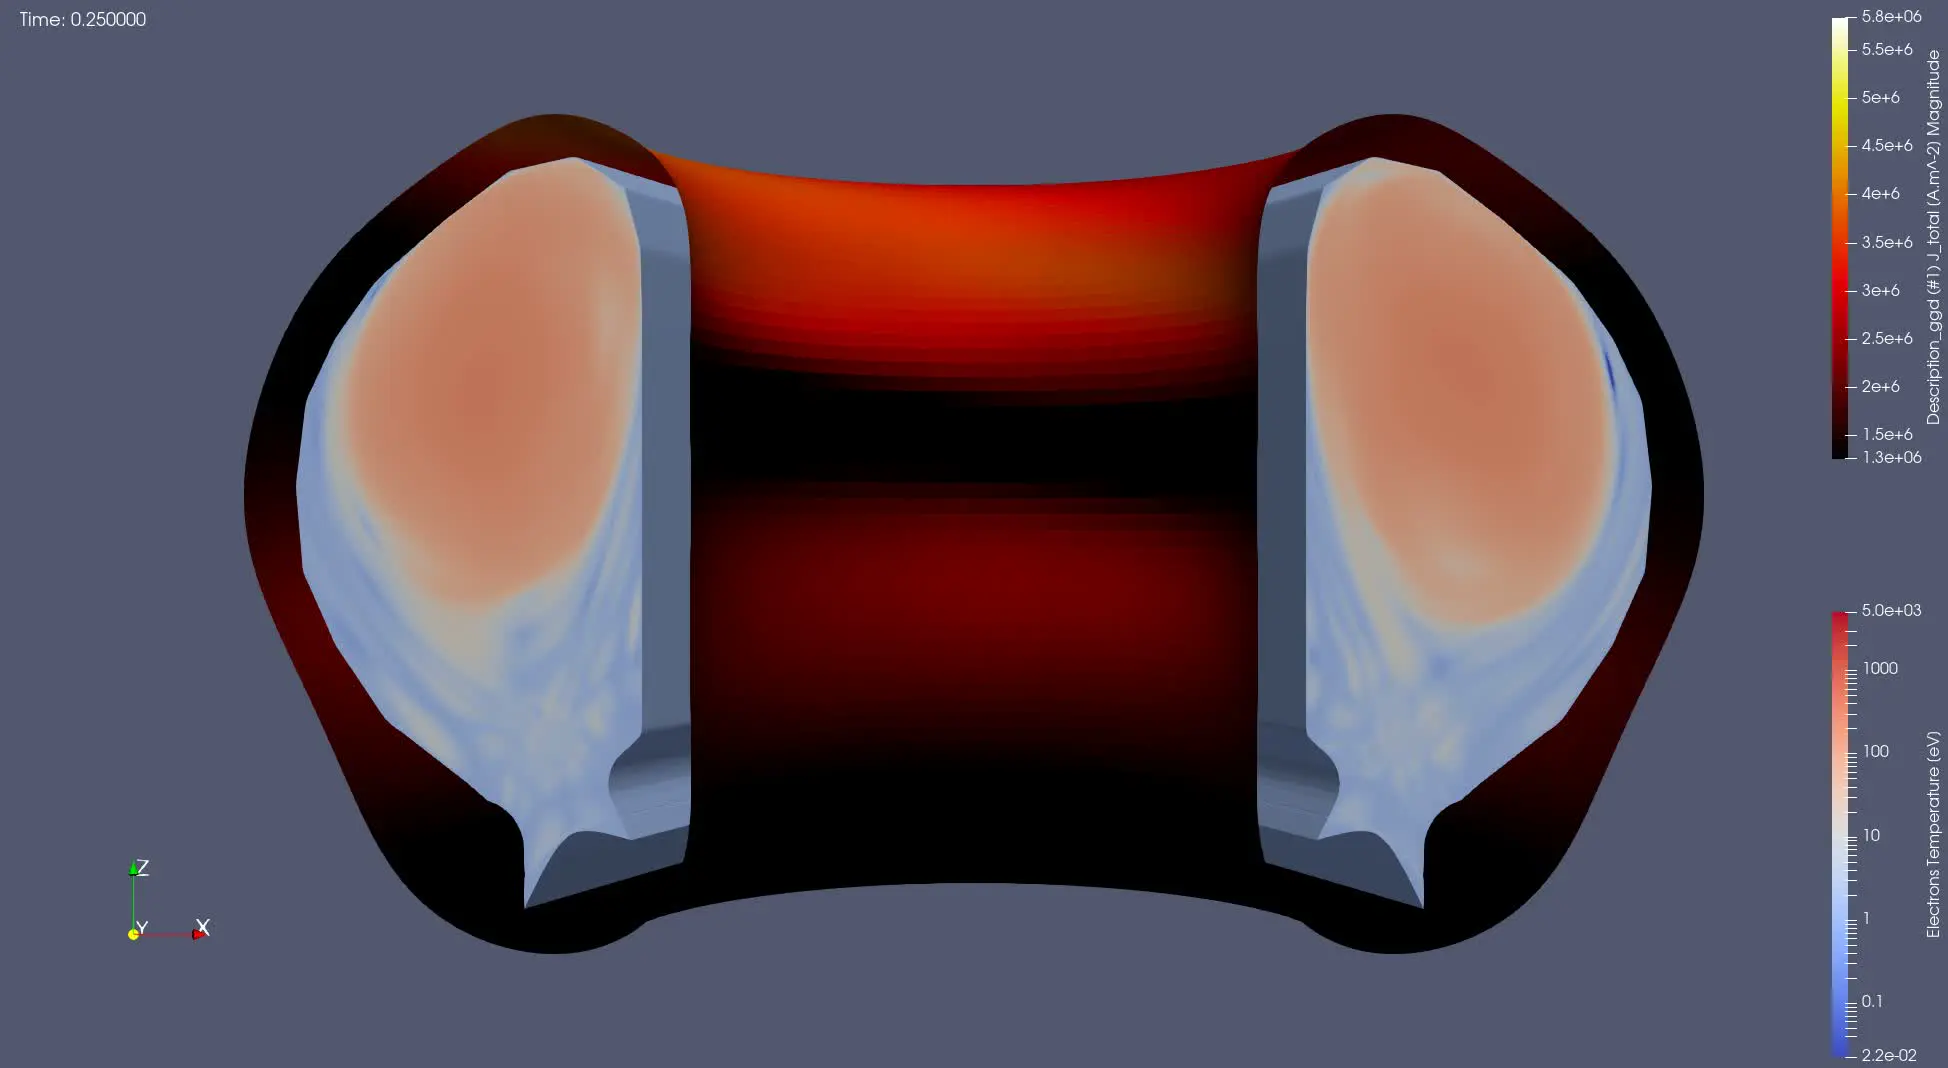
JOREK Electron Temperature and Wall Currents
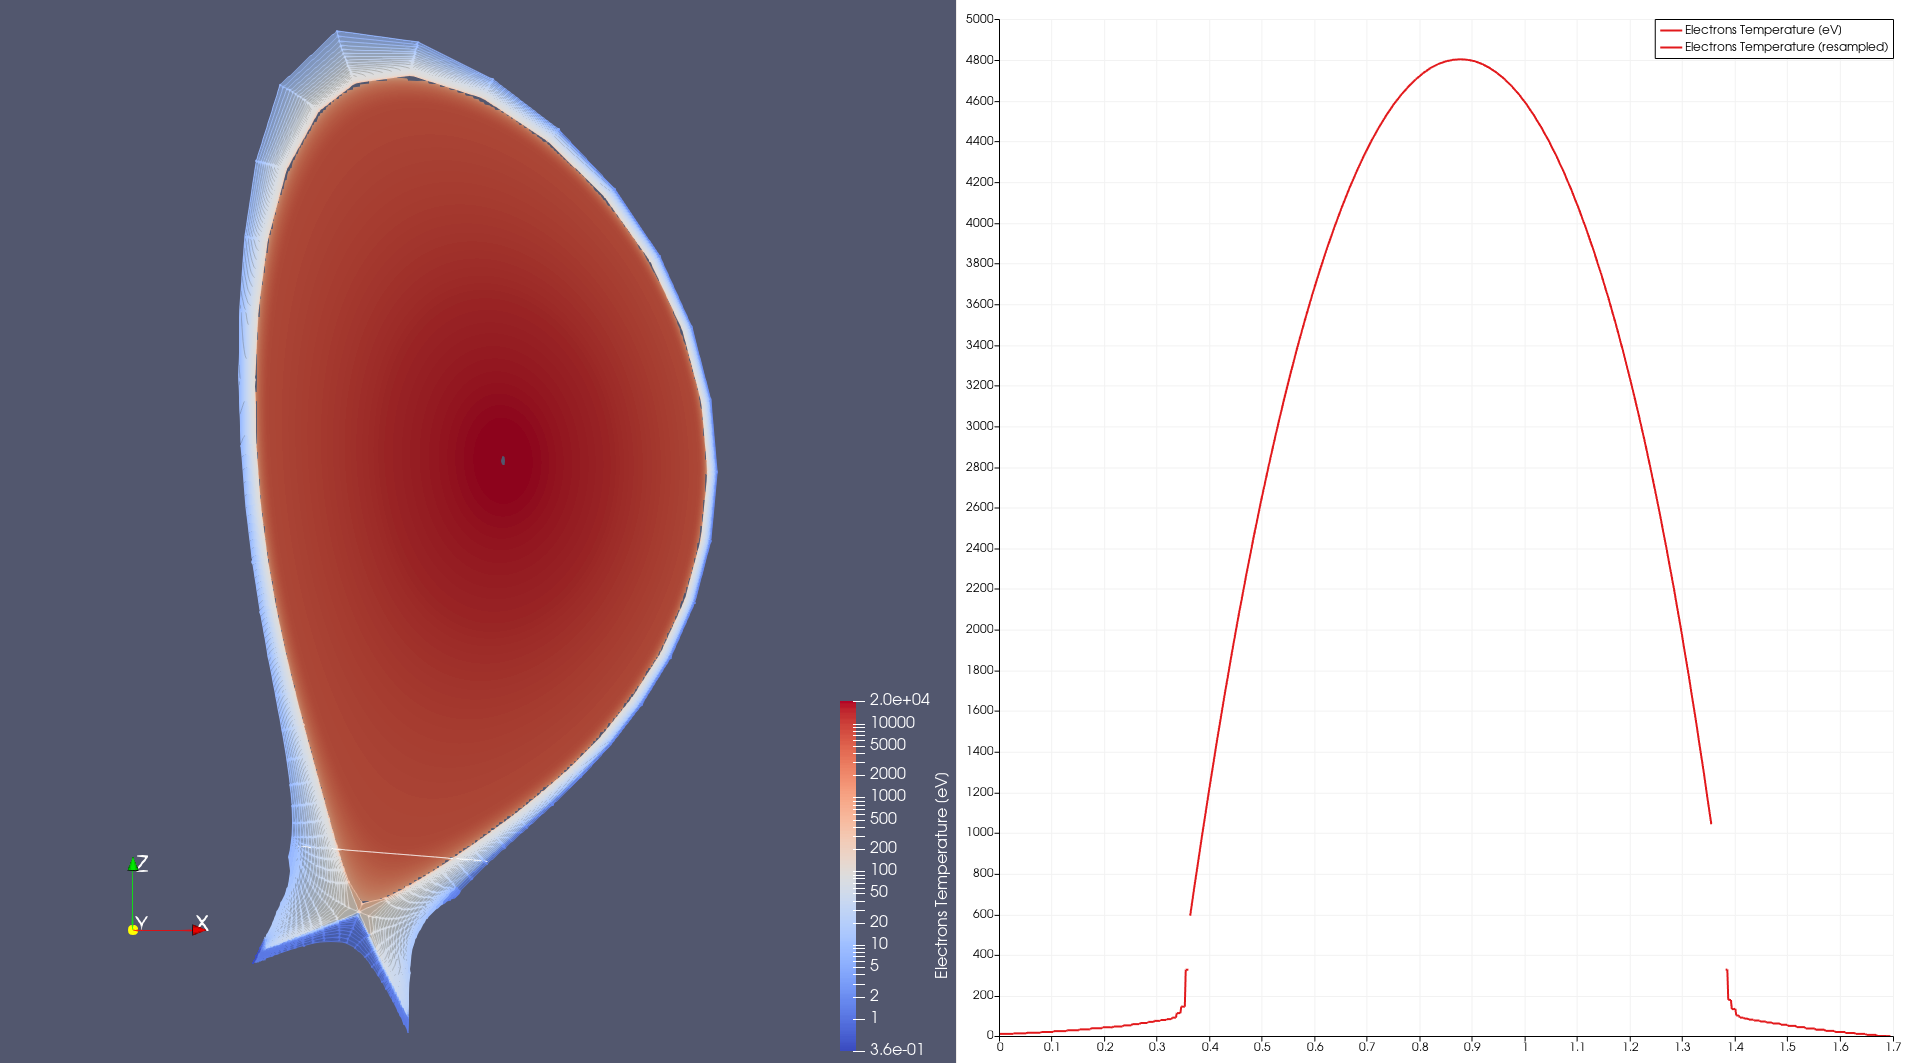
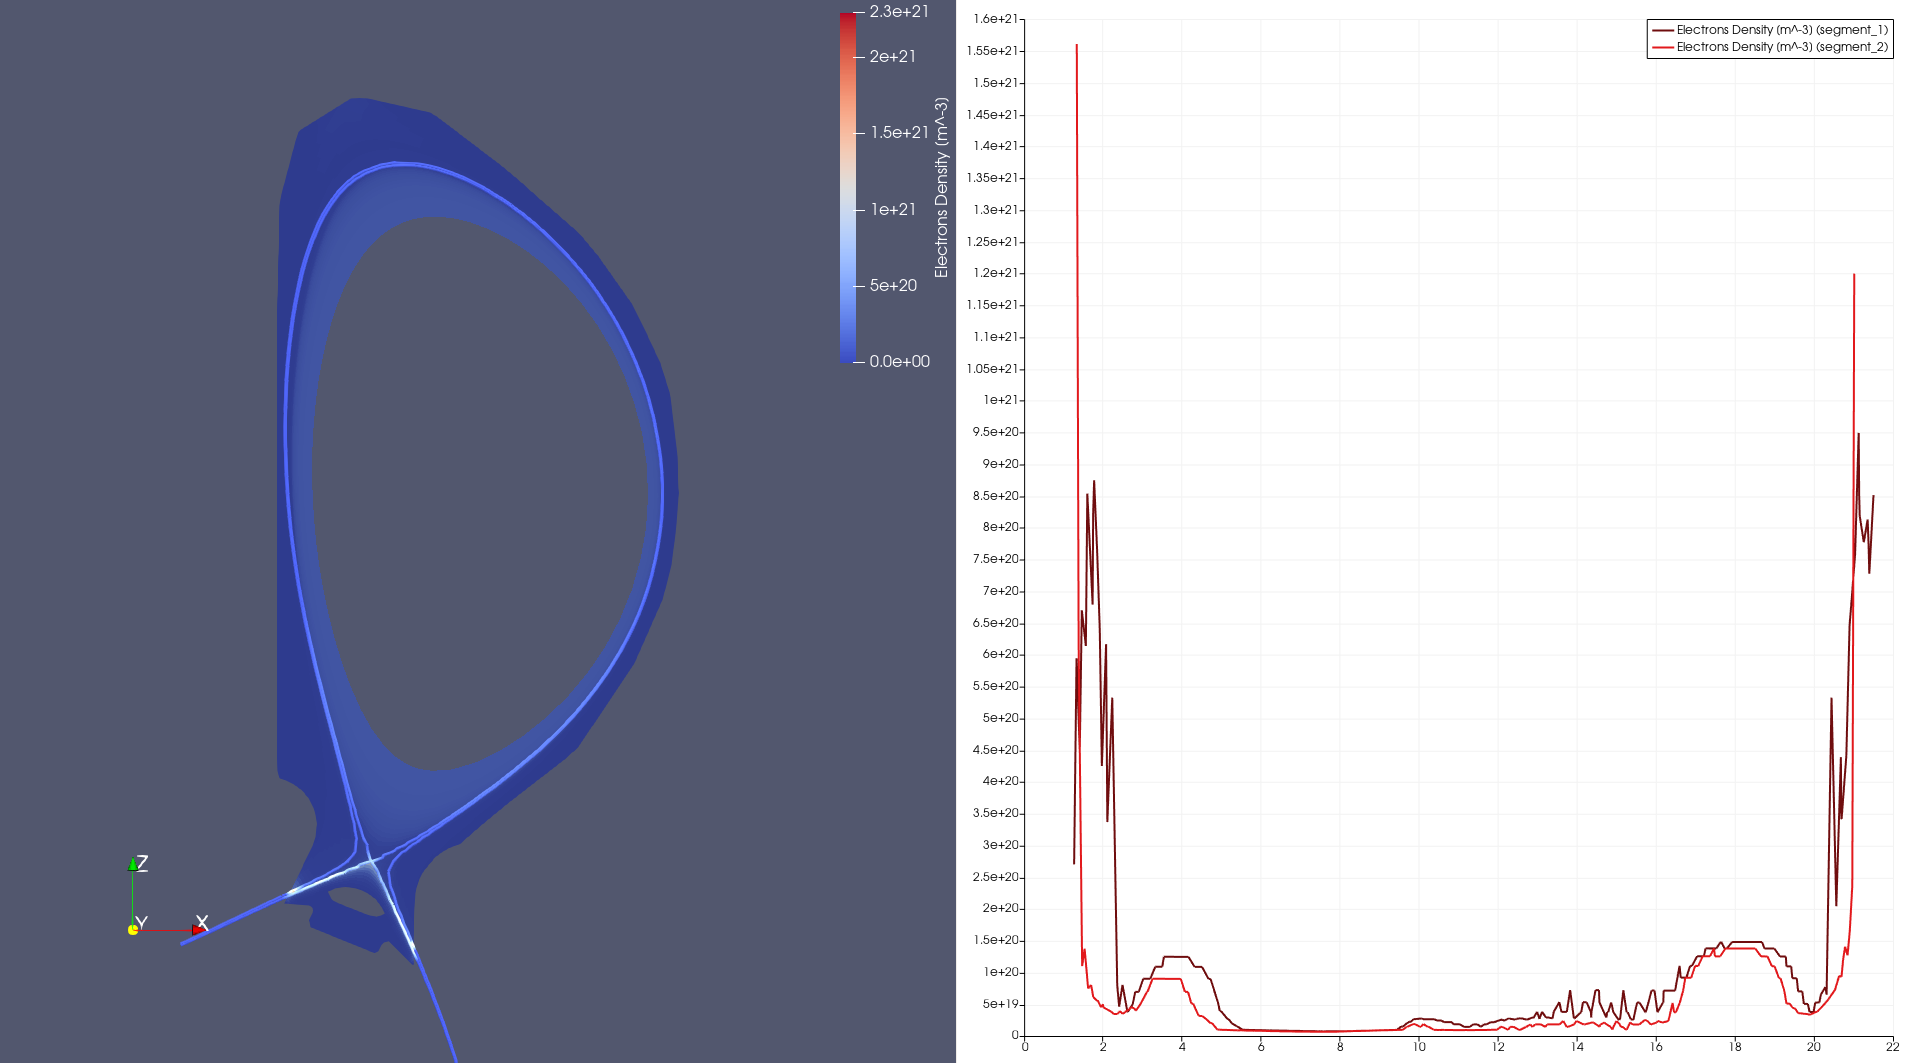
Plot over line in core and edge plasma
Plotting over magnetic field lines
Contributing to the Gallery
Have a cool visualisation made with IMAS-ParaView? We'd love to feature it here! Contributions are welcome via a pull request on the IMAS-ParaView GitHub repository.
Please follow the steps below to contribute:
Create a fork of the IMAS-ParaView repository.
Create a new directory in
docs/source/gallery/examples.Create a
description.yamlfile in that directory (see template below).Add an image showcasing the visualisation to the same directory (only
.png,.jpeg,.jpg,.gif, or.webpfile formats are supported)Optionally add a ParaView state file (
.pvsm) to the same directory, so other users can easily load your example.Open a pull request from your fork back to the main repository on the
developbranch. A maintainer will review and merge it.
Example description.yaml:
title: My Visualization
author: Your Name
description: |
  A description of what the visualization shows.
  Can be multiple lines.
uri: imas:hdf5?path=/path/on/sdcc # May also be a list of URIs
link: www.example.com # Optional link (e.g. to dataset on Zenodo)
imas_paraview_version: 2.3.0