Plotting over magnetic field lines
Author: S. Korving
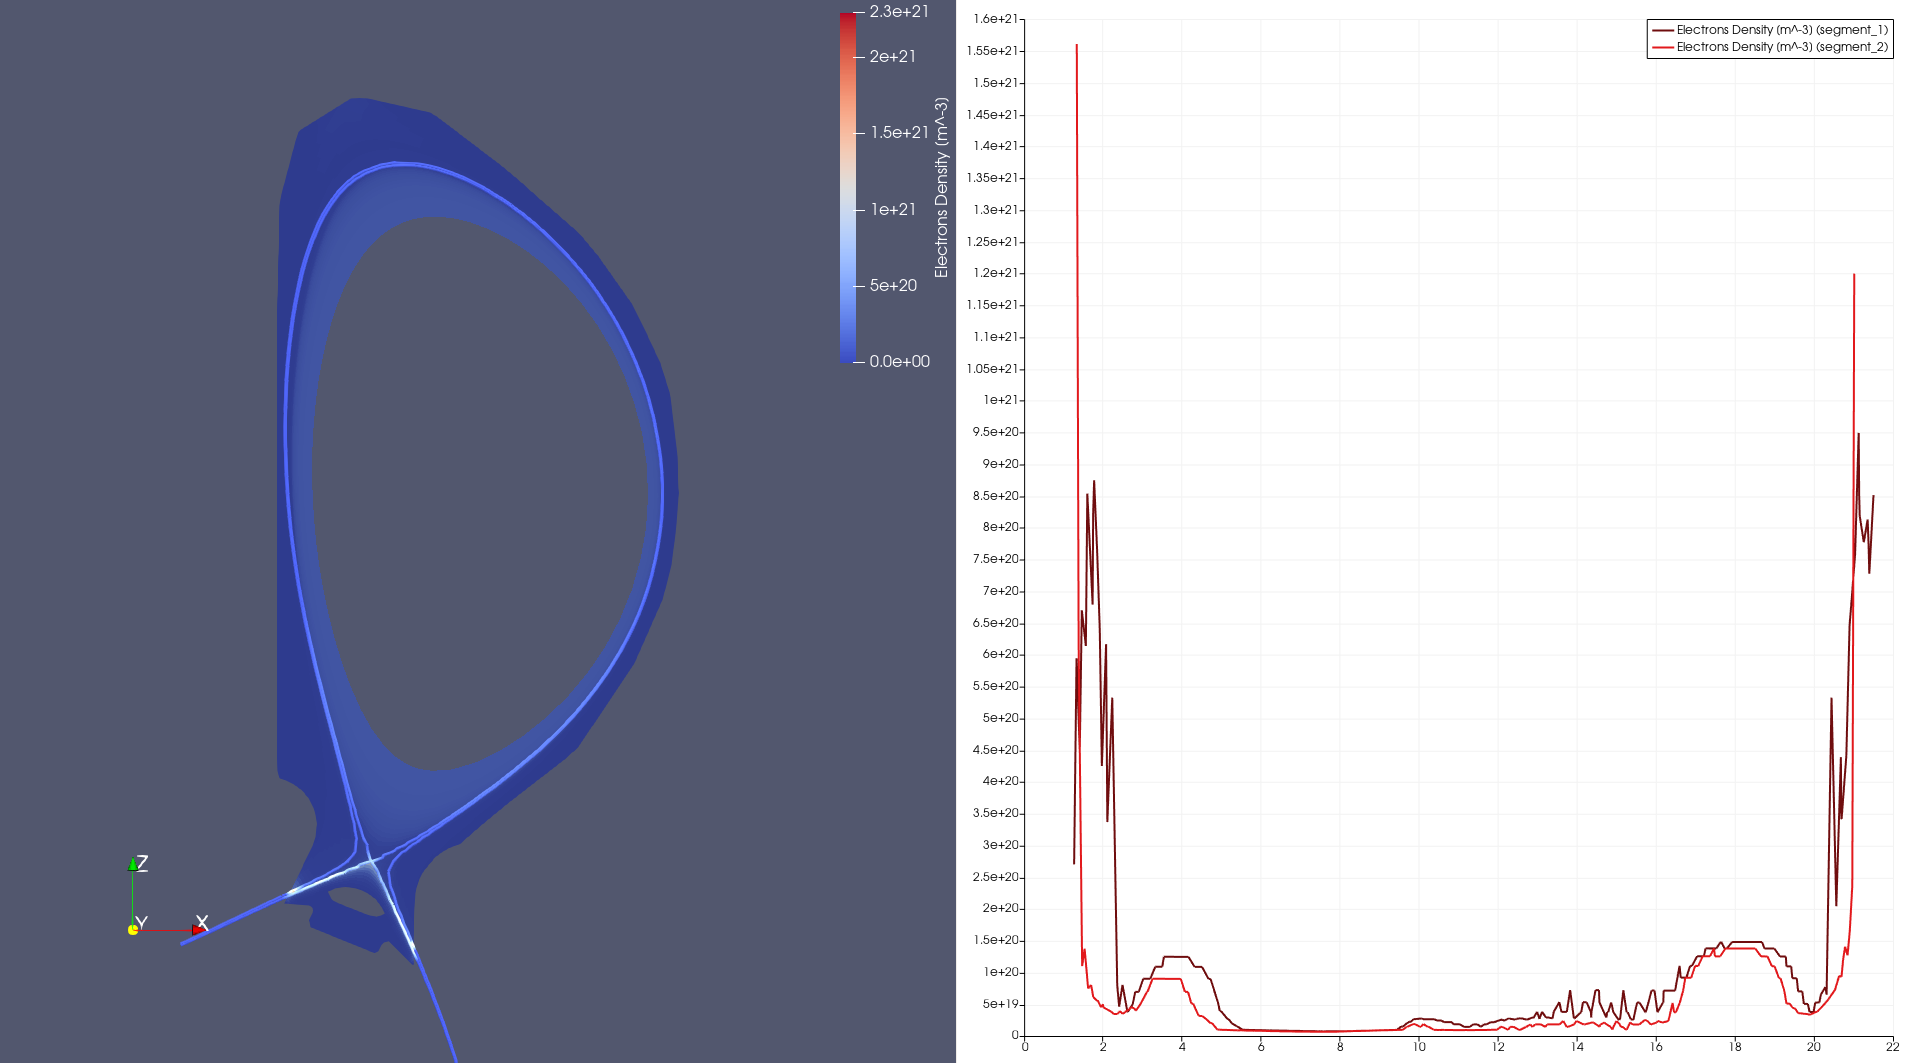
This example shows how to plot the values of a GGD quantity (here electron density) along a magnetic field line from a 2D psi profile of an equilibrium IDS.
Data URI:
imas:hdf5?path=/work/imas/shared/TEST/simulations/test/8743dad6d7f211ef8fd59440c9e7706c/imasdb/iter/3/53298/2
IMAS-ParaView version: 2.4.0
Last update:
2026-06-24