Plot over line in core and edge plasma
Author: S. Korving
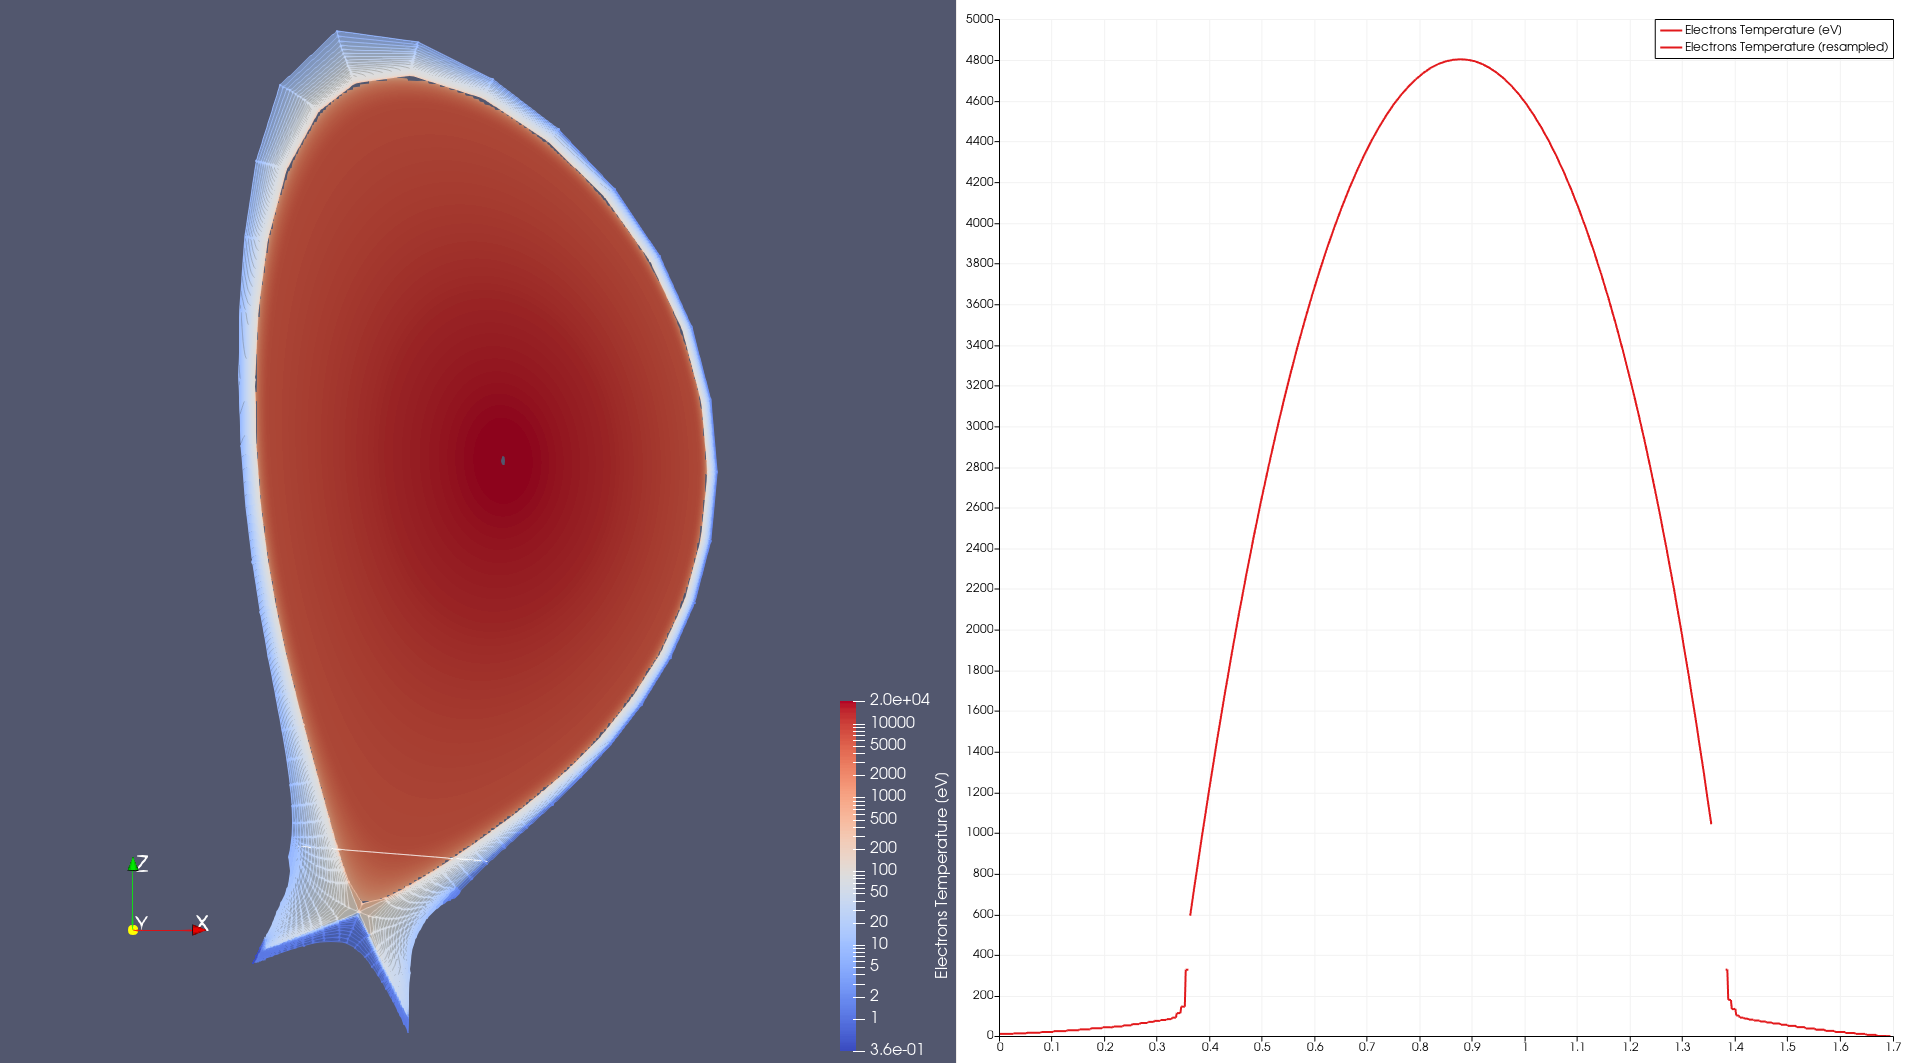
This example shows how to apply the Plot Over Line filter to visualize the
electron temperature in the edge and core plasma from a JINTRAC simulation.
In the edge, the electron temperature is loaded from an edge_profiles GGD grid.
In the core, the 1D profile from core_profiles is mapped onto a 2D grid,
using the 2D Profiles Reader.
Data URI:
imas:hdf5?path=/work/imas/shared/TEST/simulations/test/8743dad6d7f211ef8fd59440c9e7706c/imasdb/iter/3/53298/2
IMAS-ParaView version: 2.4.0
Last update:
2026-06-24